
Table 1.
The G+C content of each species’ RCPs, regions of the RCPs excluding the homopeptide, and the transcriptome as a whole
Click on table to view larger version.
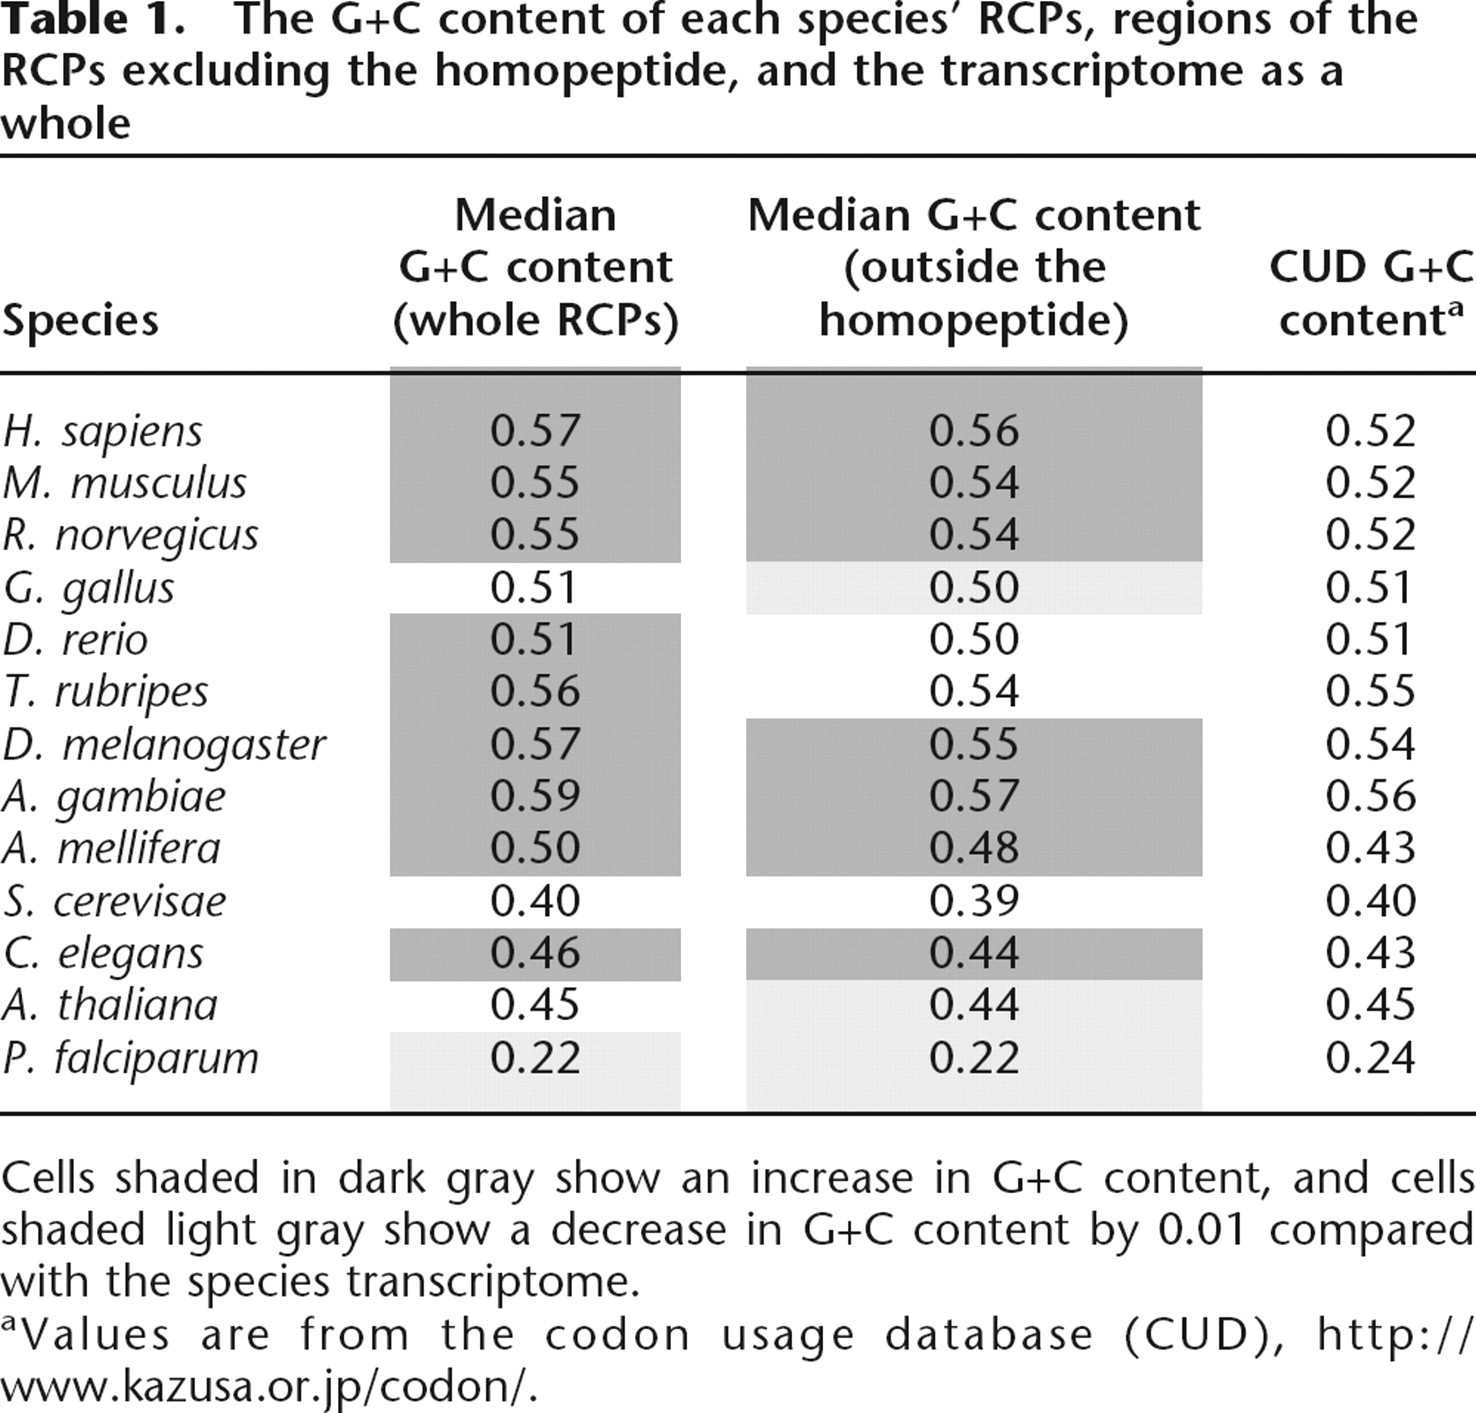
Cells shaded in dark gray show an increase in G+C content, and cells shaded light gray show a decrease in G+C content by 0.01 compared with the species transcriptome.
aValues are from the codon usage database (CUD), http://www.kazusa.or.jp/codon/.


