
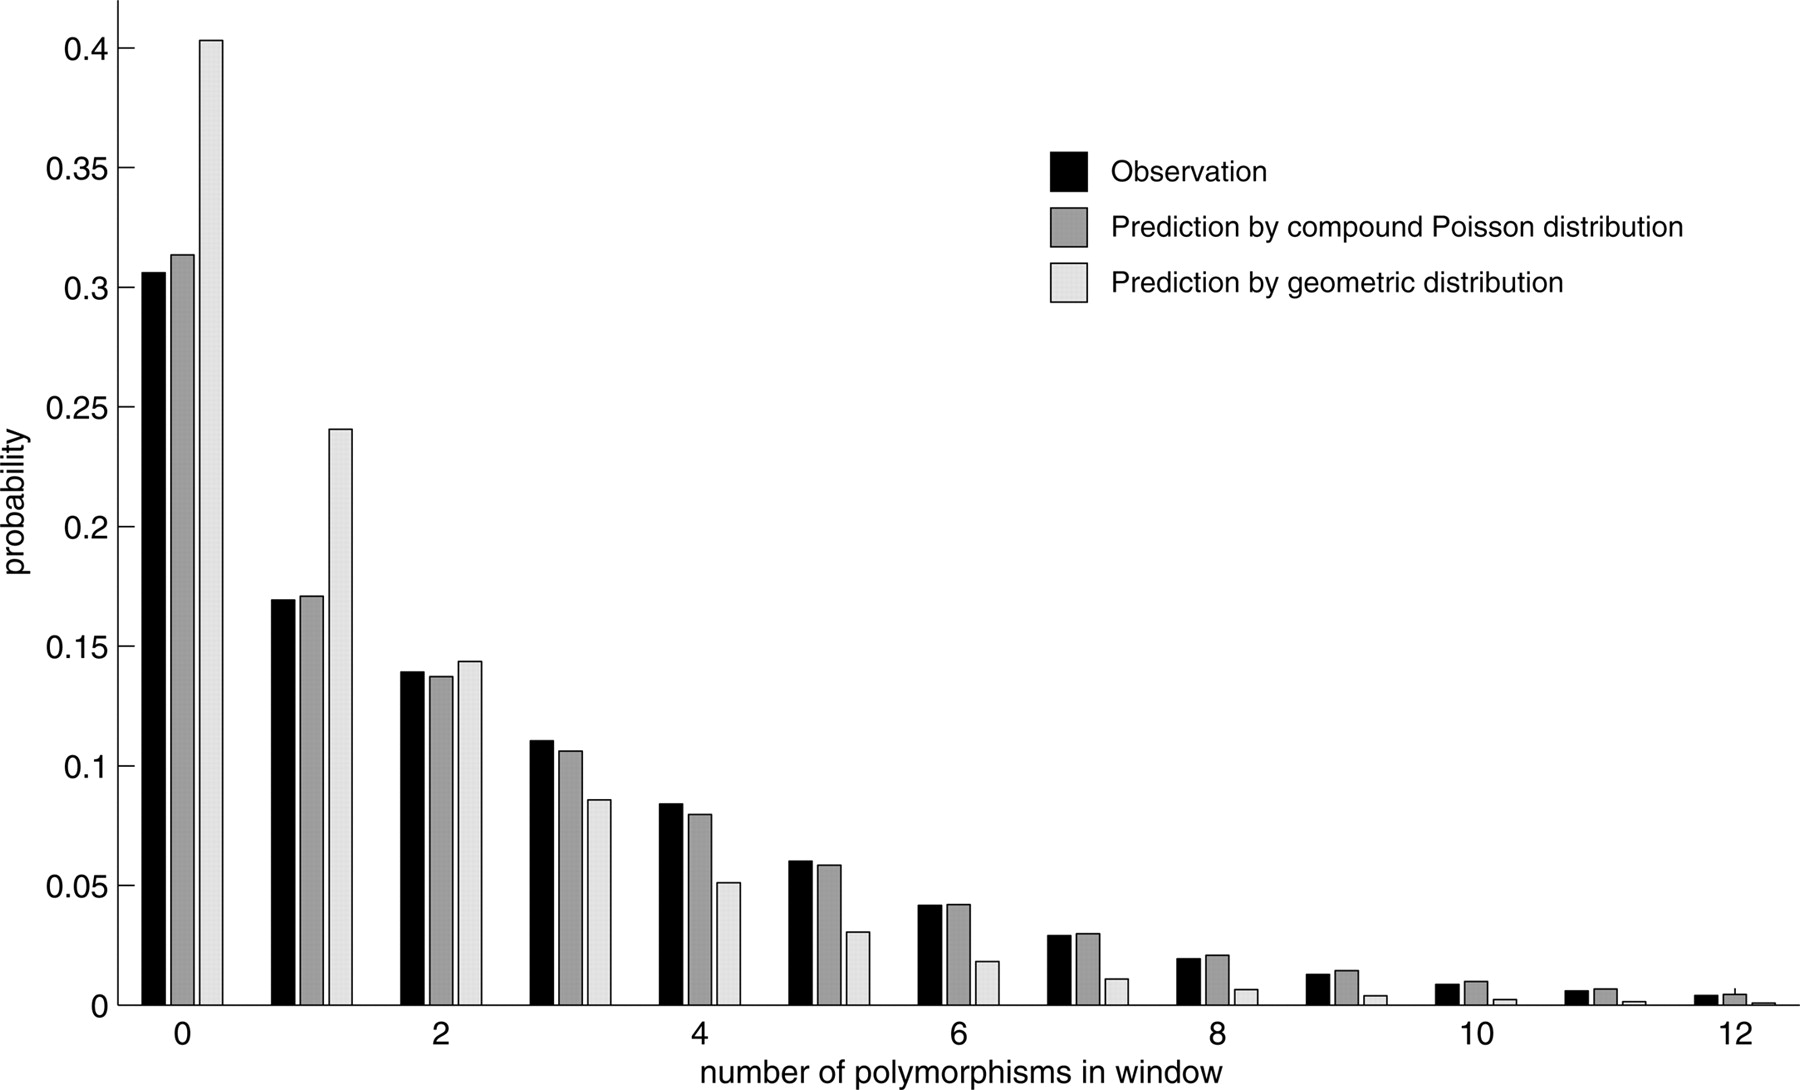
Figure 3.
Probability distribution of polymorphism rates in 200-bp windows. Black bar indicates the probability that the given number of polymorphisms is observed in 200-bp windows. Dark gray bars indicate the probability predicted by the coalescent theory, which well fits our observation in the Ciona intestinalis genome. However, a geometric distribution, indicated by light gray bars, does not fit our observations.


