
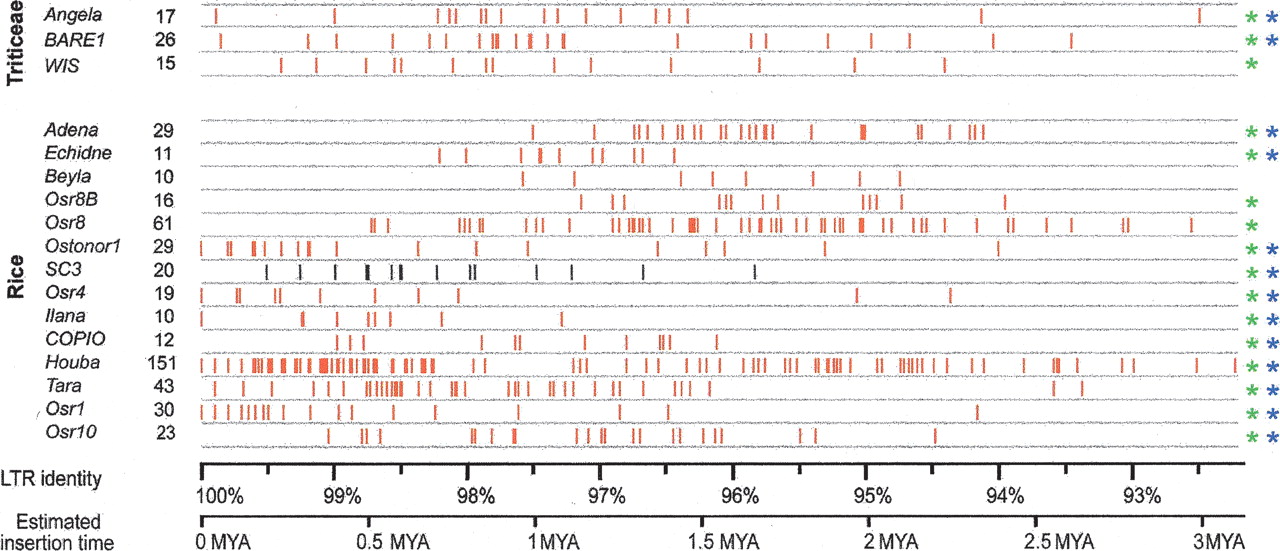
Figure 4.
Estimated insertion times of high-copy copia families from Triticeae and rice. The families studied are listed in the leftmost column. Numbers of elements analyzed for each family are given in the second column. Individual insertion events are indicated as vertical red lines. The x-axis scale indicates the DNA sequence identity between LTRs of a particular element (top) and the estimated insertion time derived from it using a basic substitution rate of 1.3 × 10⁻⁸ per site per year (bottom). Asterisks indicate whether the distribution is significantly different from a uniform distribution (P < 0.05), before (green) and after (blue) Bonferroni correction.


