
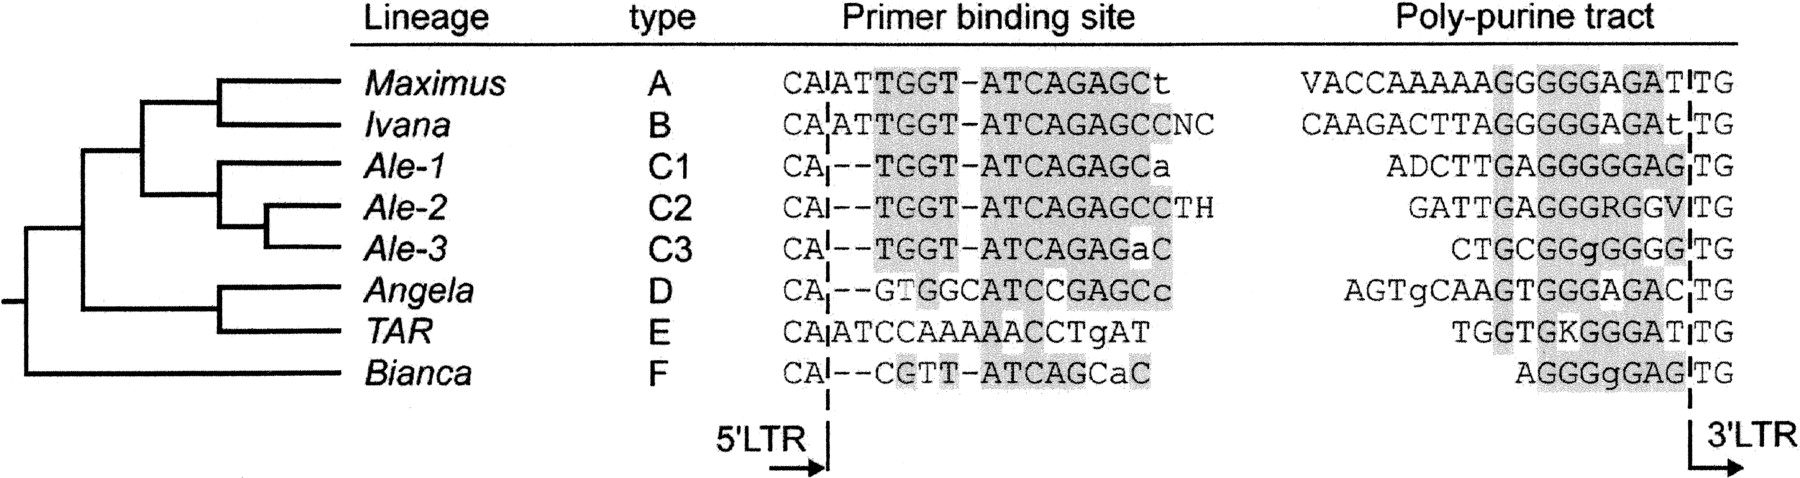
Comparison of primer binding sites (PBS) and polypurine tracts (PPT) of the six evolutionary copia lineages. The tree diagram at the left illustrates the relationship between the six evolutionary lineages as determined through the phylogenetic analysis shown in Figure 1.The terminal two bases at the 5′ end of PBS and at the 3′ end of PPT belong to the 5′ and 3′ LTRs, respectively. Shown are consensus sequences for five main lineages as well as the Ale lineage, which is split into three sublineages due to strong divergence within the Ale lineage. Each PBS/PPT pair is given a “type” index that corresponds to the one in Figure 1. The full-sequences alignments are available as Supplemental Figure 2.


