
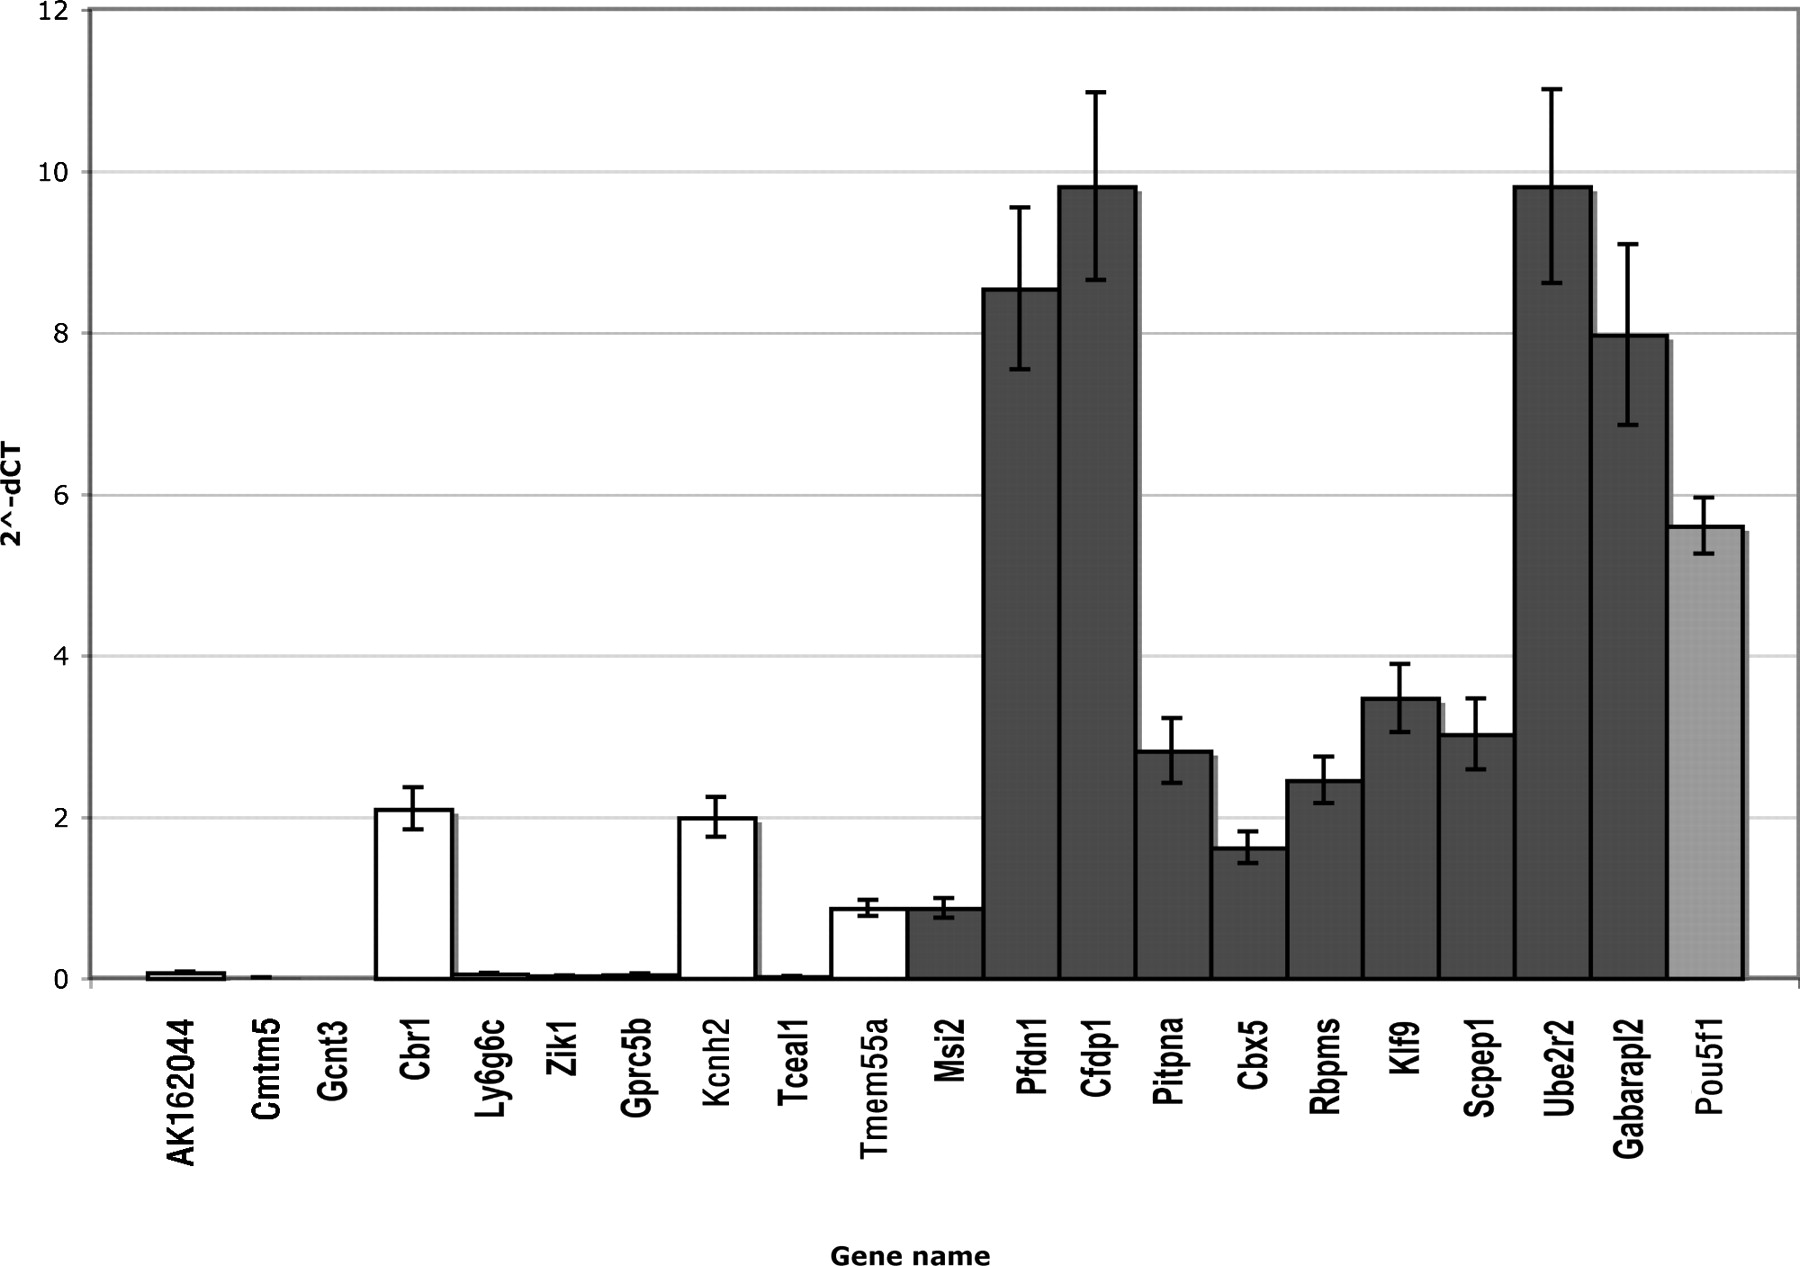
Figure 6.
Real-time RT-PCR verification of level of expression of hypertrapped RefSeq genes. The bar chart shows the levels of expressions of 10 hypertrapped genes (dark gray) and 10 genes trapped one or two times (white), as well as the Pou5f1 gene (light gray), a marker of pluripotent cell lines. Eighty percent of hypertrapped genes are expressed at significantly higher levels than genes trapped at the median rate of one trap per gene.


