
Table 1.
Correlation between intron gain and loss rates and other genomic variables
Click on table to view larger version.
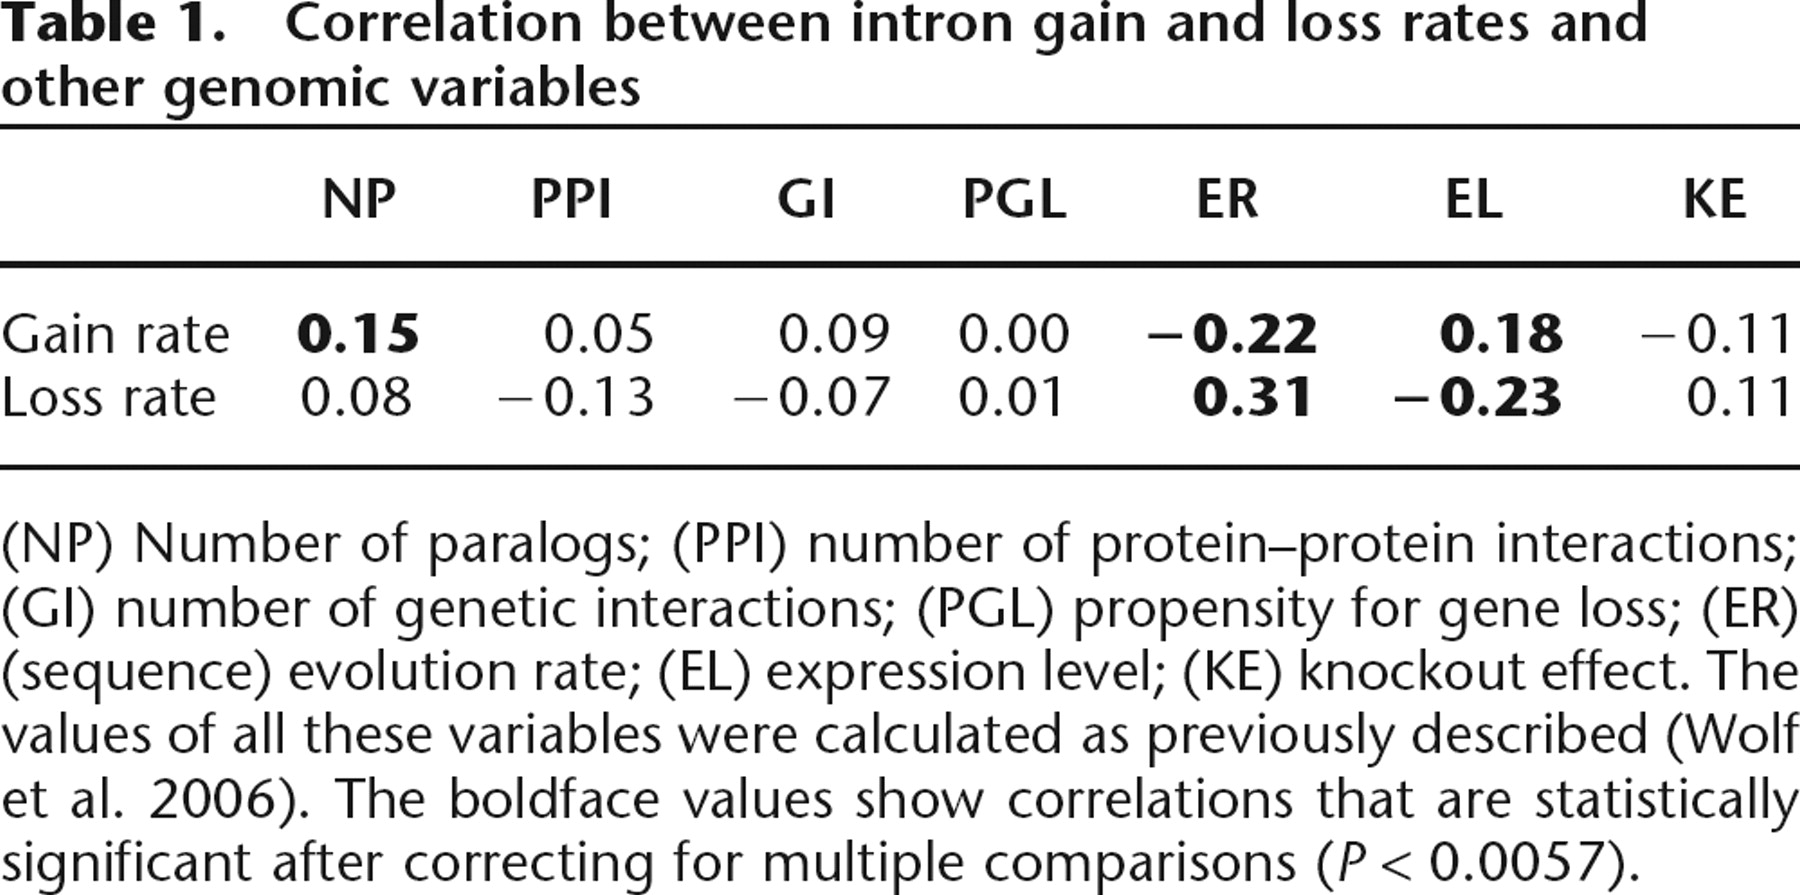
(NP) Number of paralogs; (PPI) number of protein–protein interactions; (GI) number of genetic interactions; (PGL) propensity for gene loss; (ER) (sequence) evolution rate; (EL) expression level; (KE) knockout effect. The values of all these variables were calculated as previously described (Wolf et al. 2006). The boldface values show correlations that are statistically significant after correcting for multiple comparisons (P < 0.0057).


