
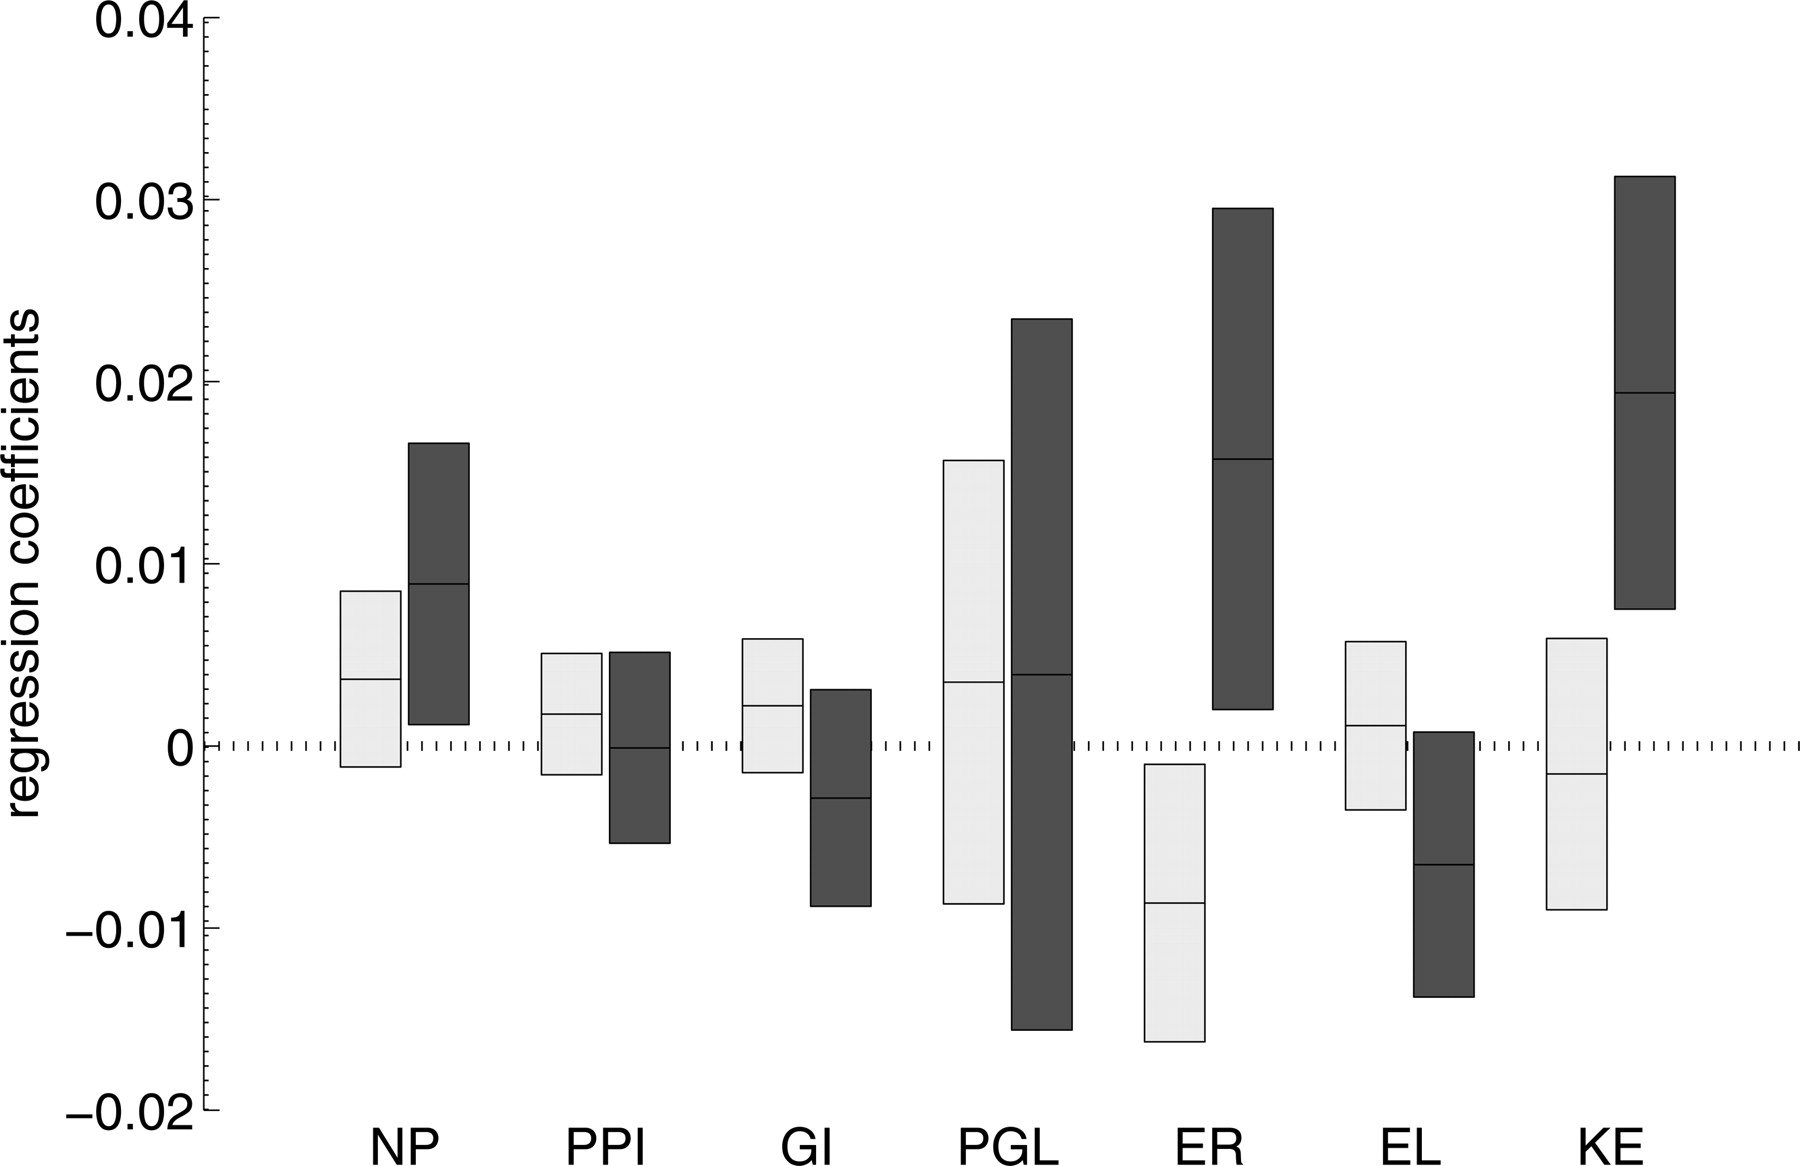
Figure 2.
Coefficients of the multiple linear regression of gene-specific intron gain rate (light gray), and of gene-specific intron loss rate (dark gray). The bars show the 95% confidence interval, and the line within each bar shows the optimal value.


