
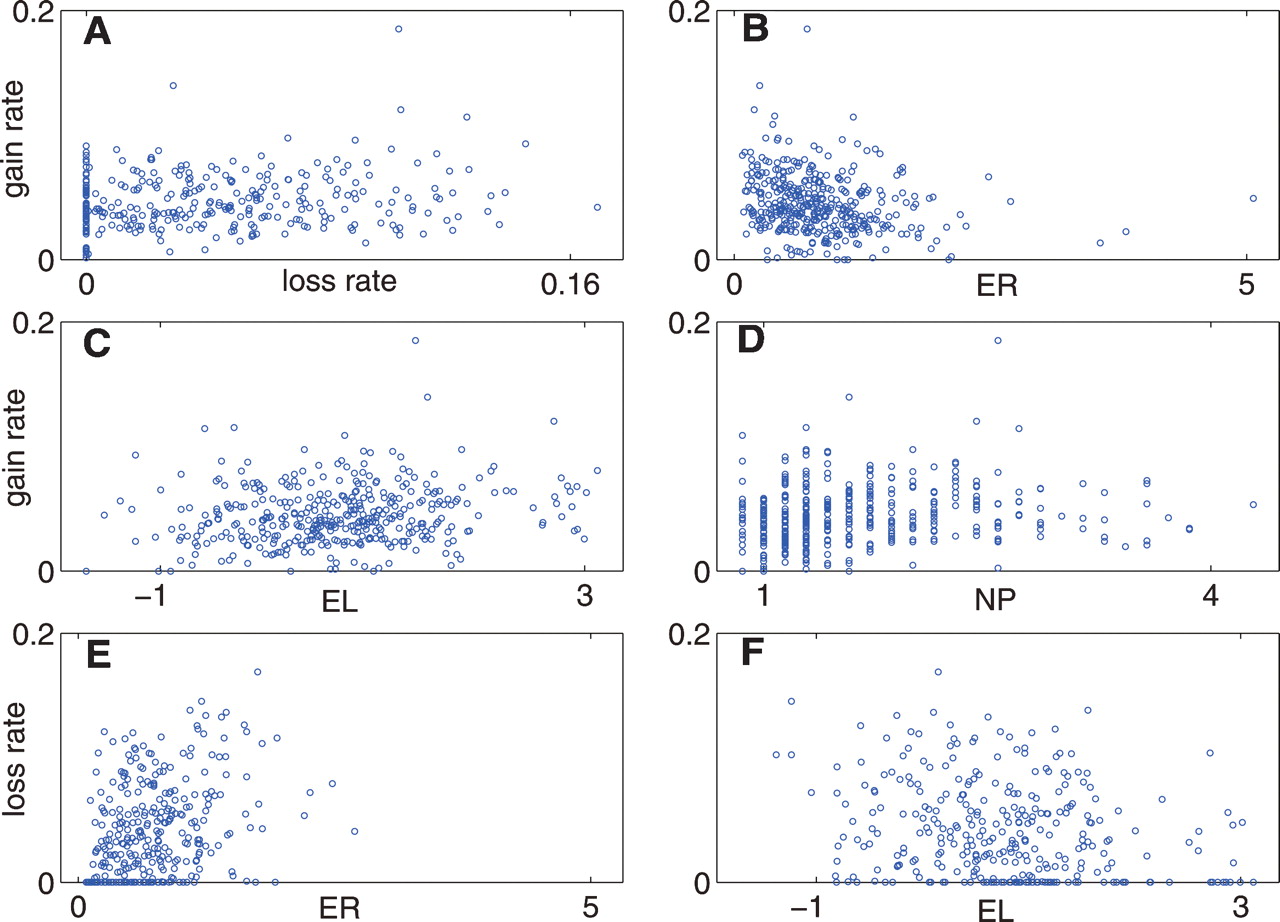
Scatter plots of the gene-specific intron gain and loss rates versus other genomic variables. (A) Intron gain rate vs. intron loss rate; (B) intron gain rate vs. gene evolution rate (ER); (C) intron gain rate vs. gene expression level (EL); (D) intron gain rate vs. number of paralogs (NP); (E) intron loss rate vs. gene evolution rate; (F) intron loss rate vs. gene expression level. Units of the variables: gain rate (arbitrary units); loss rate (arbitrary units); ER (average over a KOG of median normalized JTT distances); EL (maximum among paralogs of standardize log-values of expression readings); NP (average number of paralogs across seven eukaryotic species) (for details, see Wolf et al. 2006).


