
Table 3.
Intron gain and loss rates of individual branches
Click on table to view larger version.
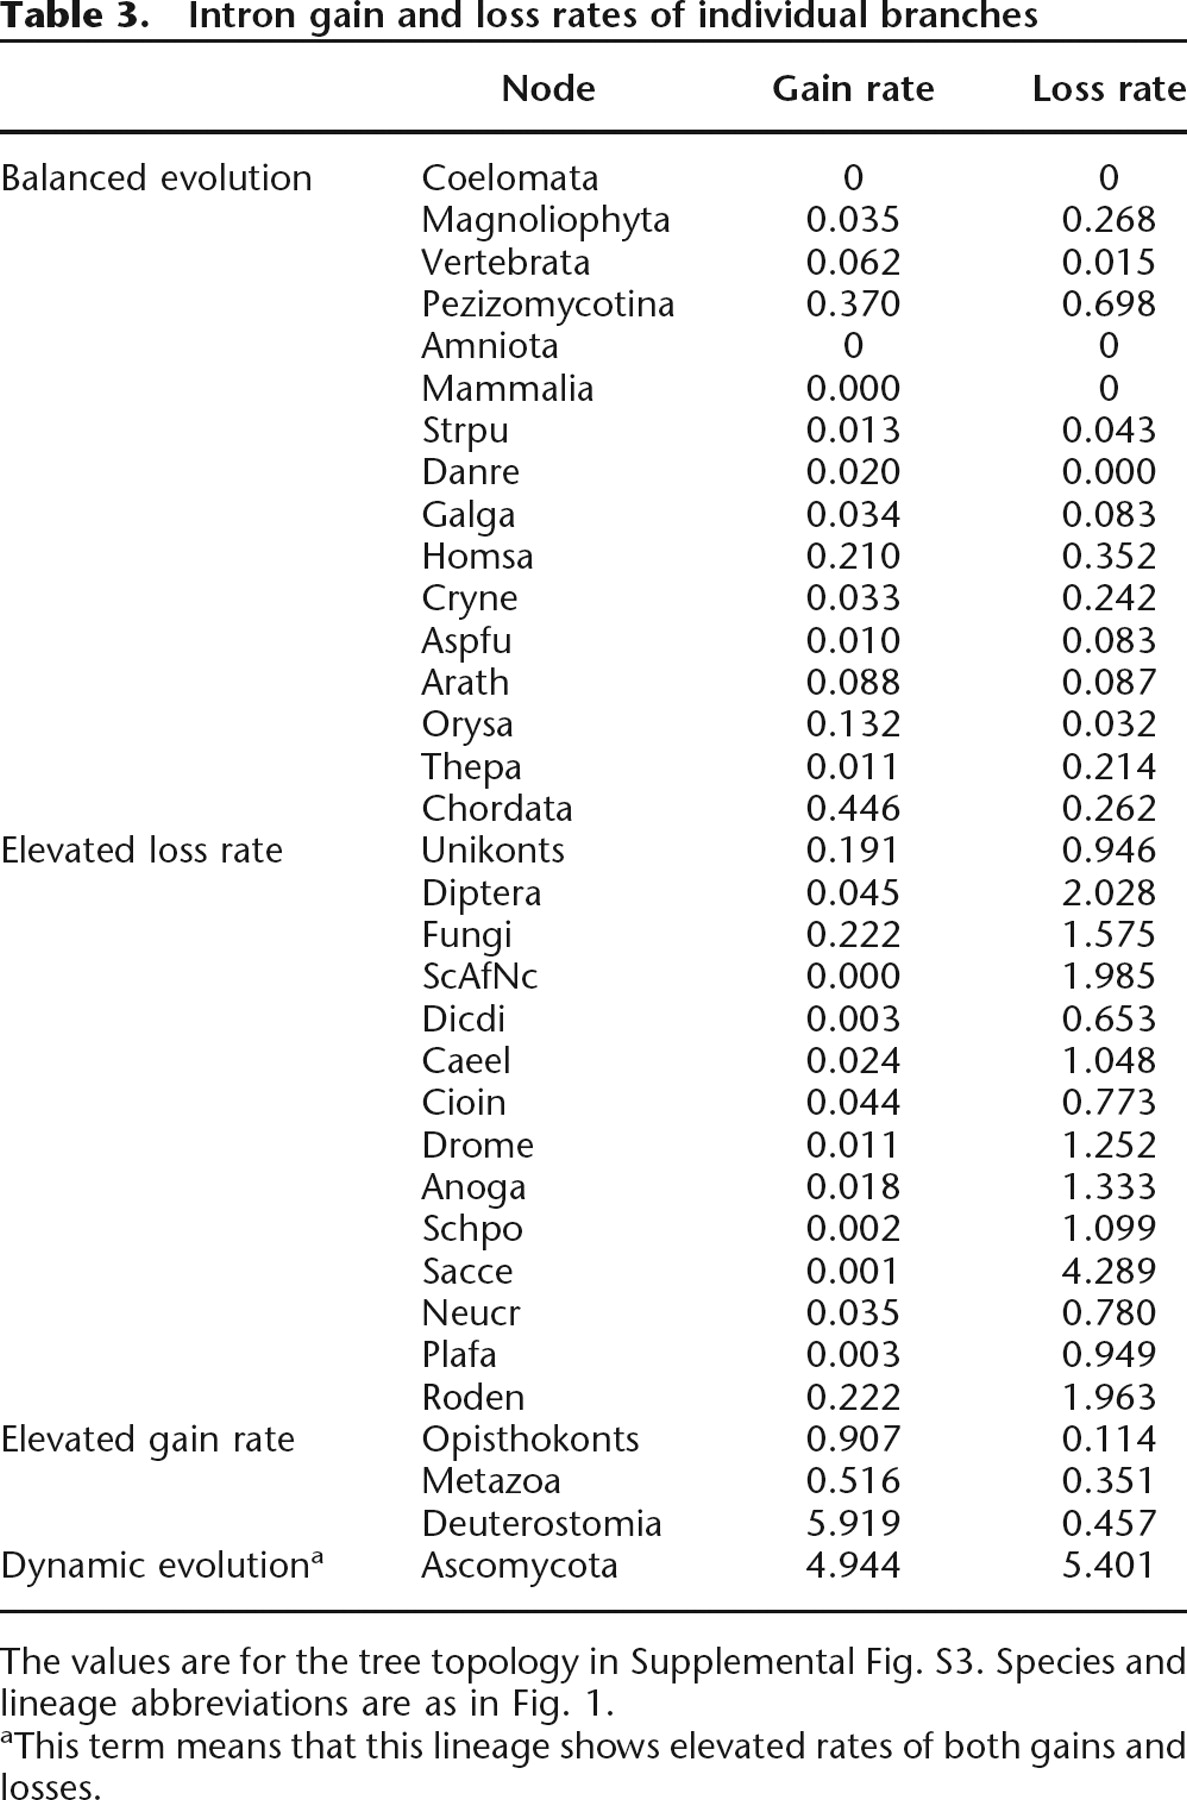
The values are for the tree topology in Supplemental Fig. S3. Species and lineage abbreviations are as in Fig. 1.
aThis term means that this lineage shows elevated rates of both gains and losses.


