
Table 1.
Intron densities (known or inferred) for each node, as well as inferred density of intron gain and loss events along each branch
Click on table to view larger version.
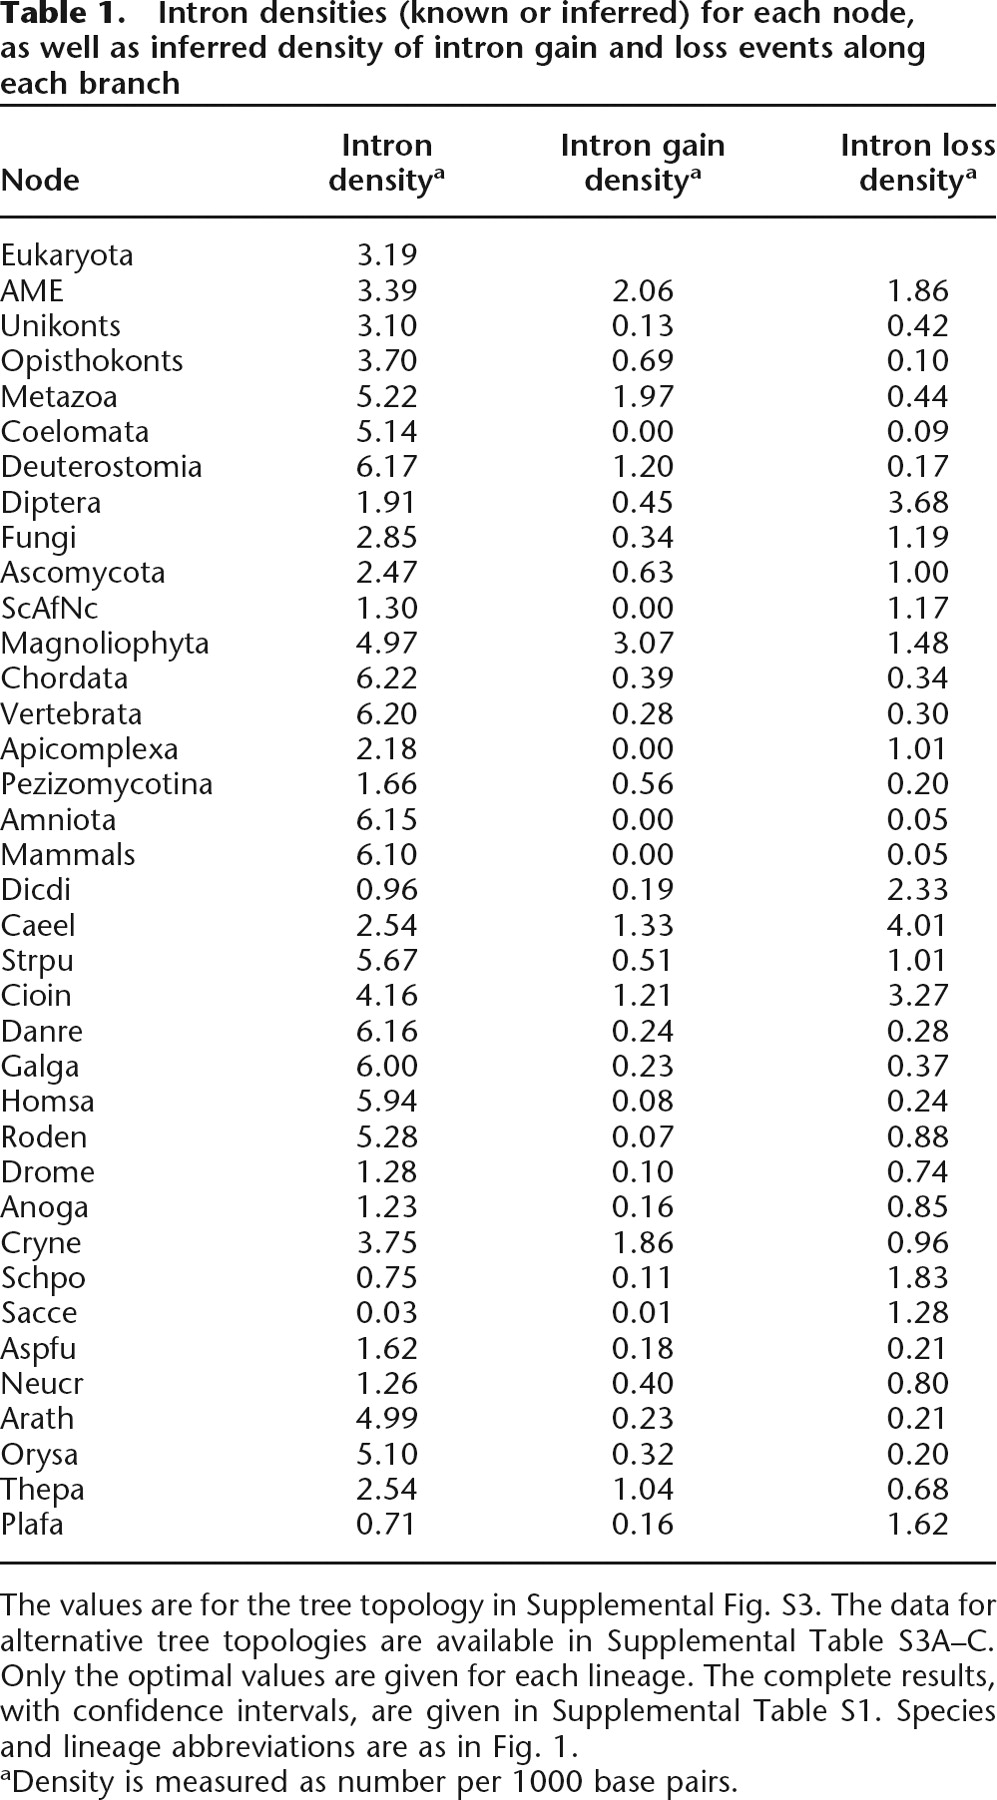
The values are for the tree topology in Supplemental Fig. S3. The data for alternative tree topologies are available in Supplemental Table S3A–C. Only the optimal values are given for each lineage. The complete results, with confidence intervals, are given in Supplemental Table S1. Species and lineage abbreviations are as in Fig. 1.
aDensity is measured as number per 1000 base pairs.


