
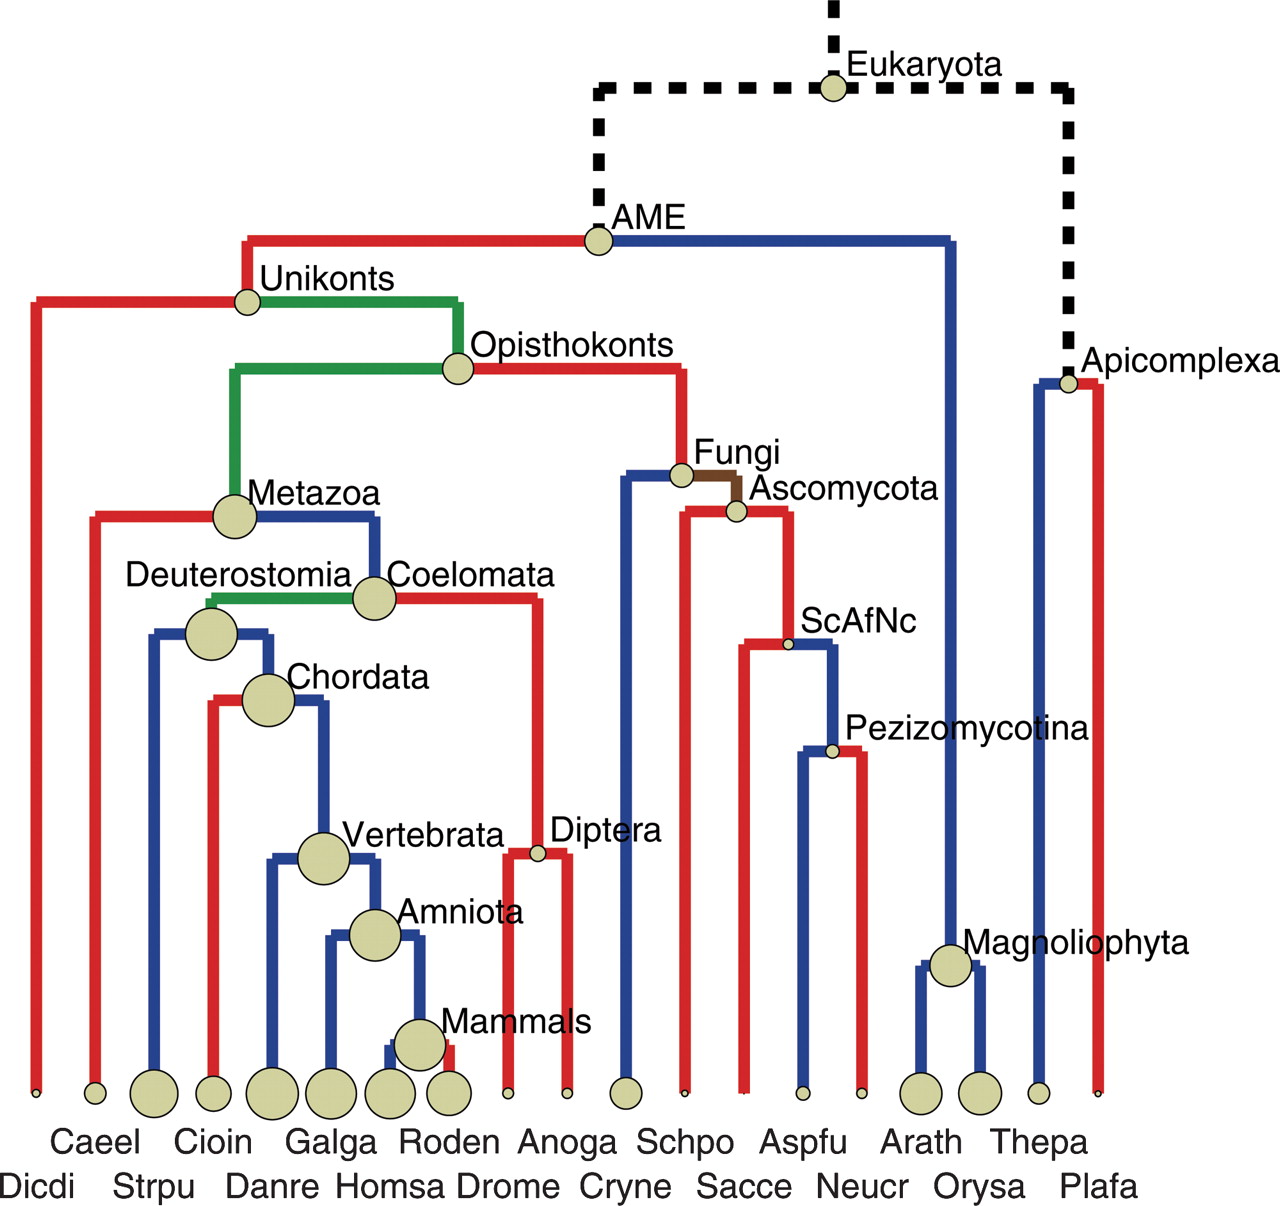
Figure 4.
Distribution of intron gain and loss rates over the phylogenetic tree of eukaryotes. Node sizes are proportional to their (known or inferred) intron density, and the branches are color-coded: (green) predominant intron gain; (red) predominant intron loss; (blue) balanced gain and loss. The sole brown branch (Ascomycota) designates extensive (significantly greater than the mean over the tree) gains and losses. Species and lineage abbreviations are as in Fig. 1.


