
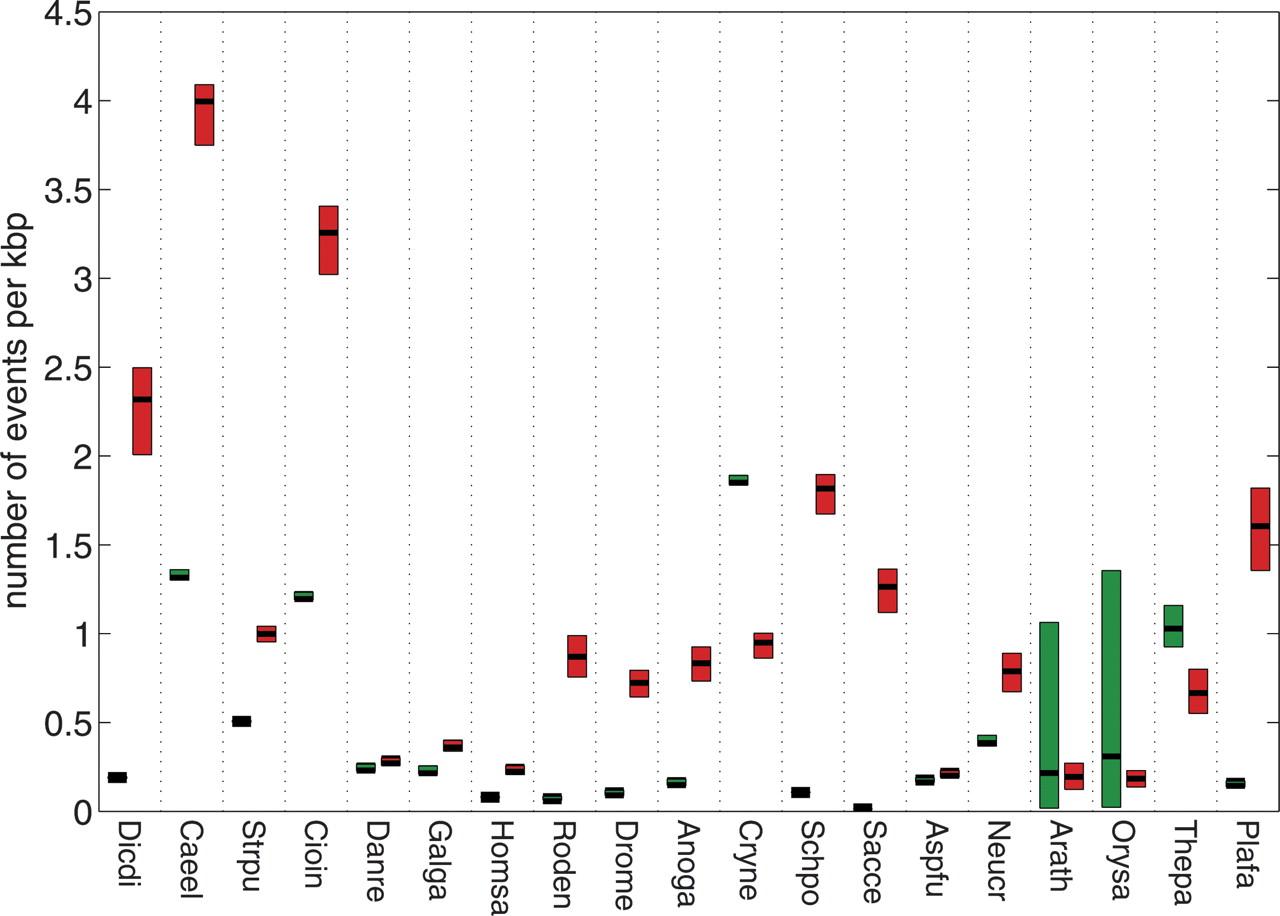
Figure 3.
Density of intron gain and loss events in extant species. (Green bars) 95% confidence interval of gains; (red bars) 95% confidence interval of losses; (central black line) the optimal value. Species abbreviations are as in Fig. 1. Density is measured as number of events per 1000 nucleotides.


