
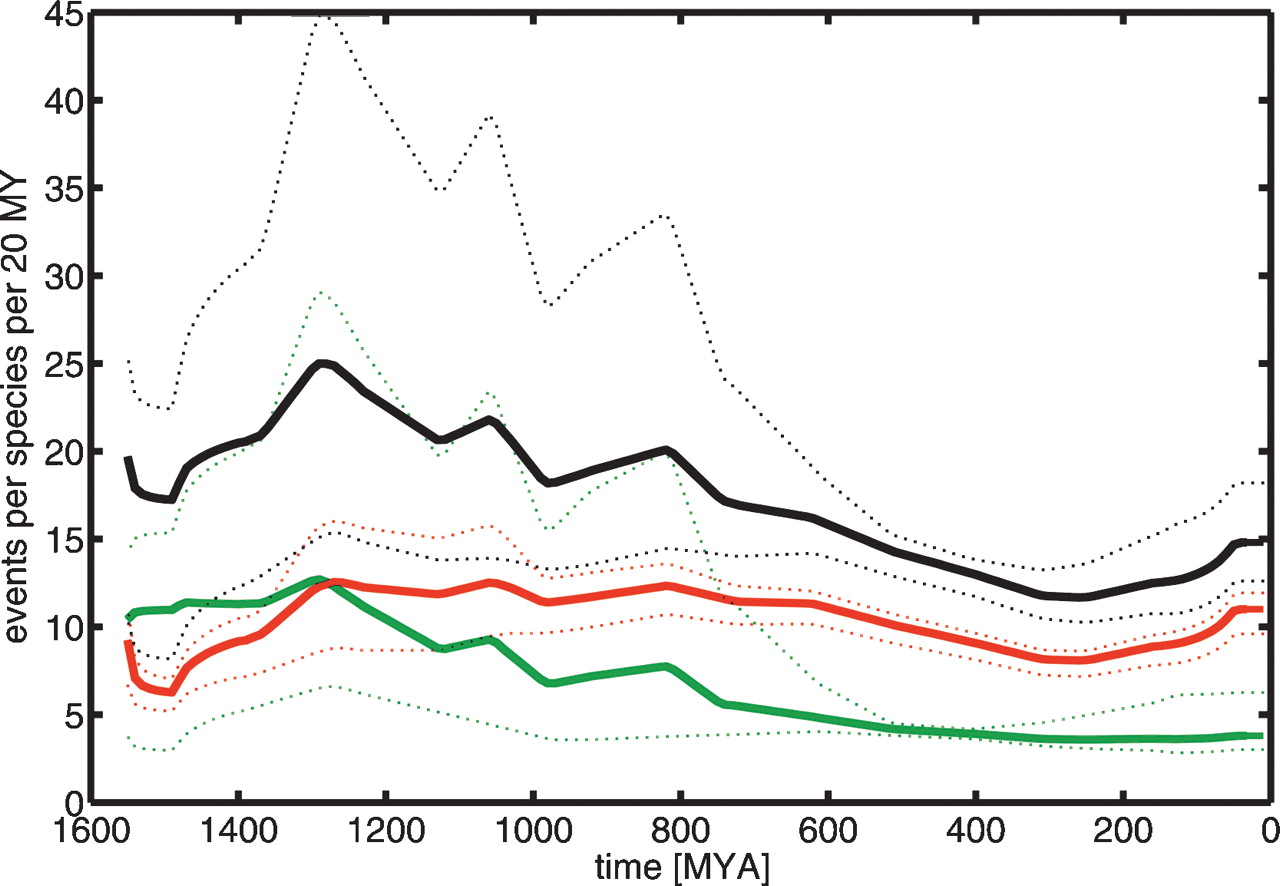
Figure 2.
Time dependence of the overall number of intron gain and loss events during eukaryotic evolution. (Green lines) Number of gain events, (red lines) number of loss events, (black lines) total number of events per species per 20 million yr (Myr). Events were counted in a 20-Myr window every 10 Myr. The results were smoothed using the moving average algorithm with a 31-time-points window. (Dashed lines) Highly conservative confidence intervals, obtained by taking the lowest and highest values in the 95% confidence interval of each lineage.


