
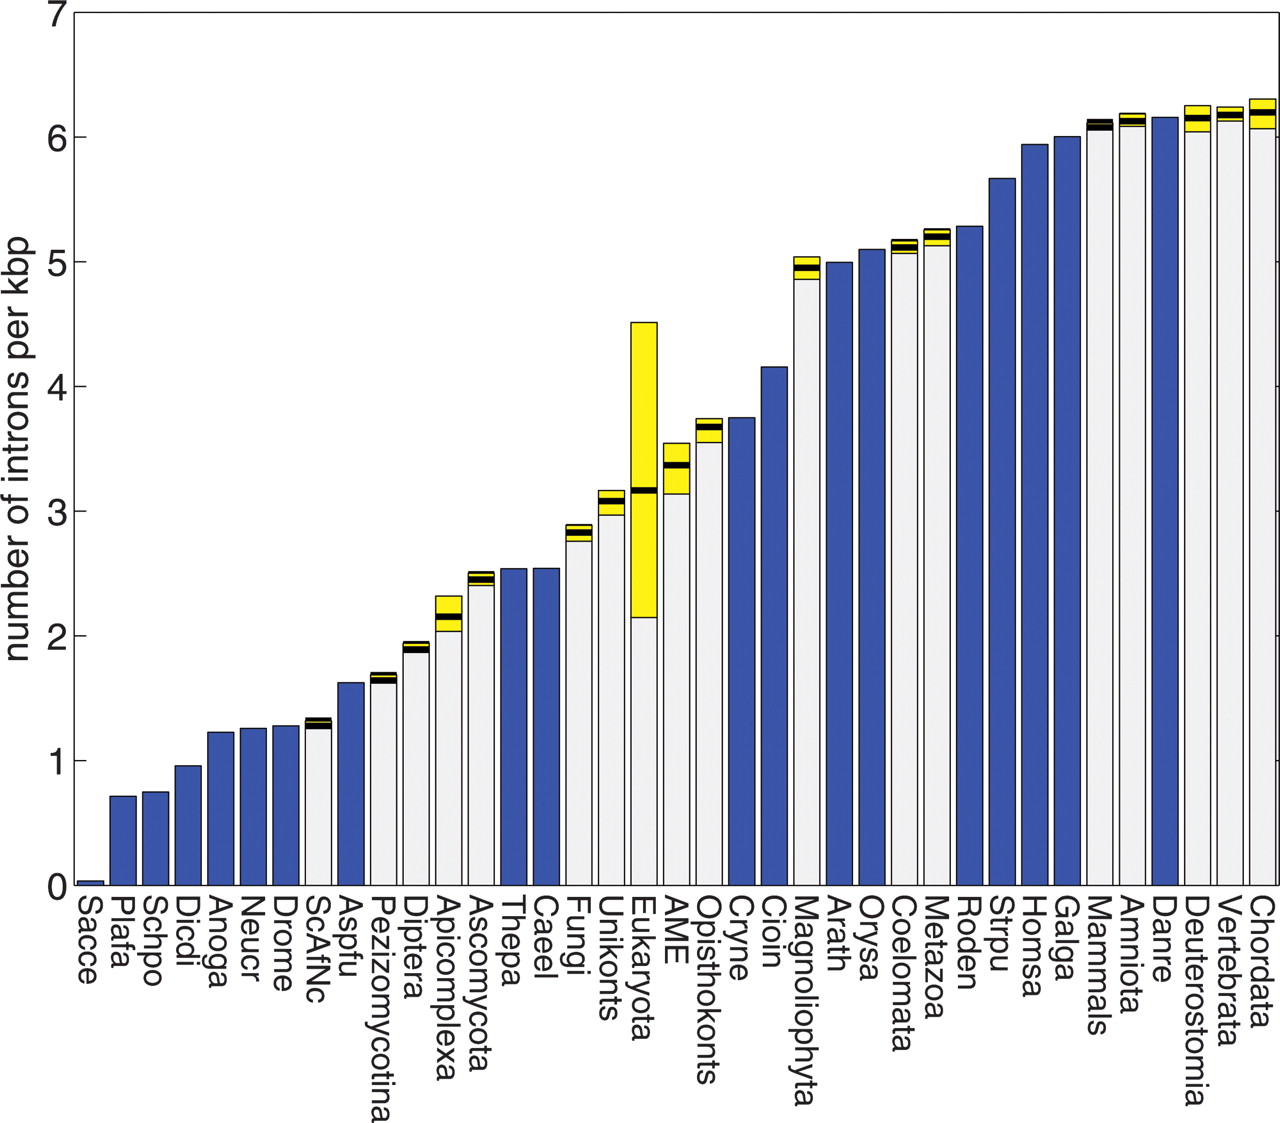
Intron density in extant species and ancestral forms. Densities are measured in introns per 1000 nucleotides. (Blue bars) The observed values for genes from extant species, (yellow bars) the 95% confidence intervals for the densities in ancestral nodes, (internal separator) the optimal value. Species and lineage abbreviations: (Caeel) Caenorhabditis elegans, (Strpu) Strongylocentrotus purpuratus, (Cioin) Ciona intestinalis, (Danre) Danio rerio, (Galga) Gallus gallus, (Homsa) Homo sapiens, (Roden) Mus musculus and Rattus norvegicus combined, (Drome) Drosophila melanogaster, (Anoga) Anopheles gambiae, (Cryne) Cryptococcus neoformans, (Schpo) Schizosaccharomyces pombe, (Sacce) Saccharomyces cerevisiae, (Aspfu) Aspergillus fumigatus, (Neucr) Neurospora crassa, (Arath) Arabidopsis thaliana, (Orysa) Oryza sativa, (Thepa) Theileria parva, (Plafa) Plasmodium falciparum, (Dicdi) Dictyostelium discoideum, (AME) Ancestor of Multicellular Eukaryotes.


