
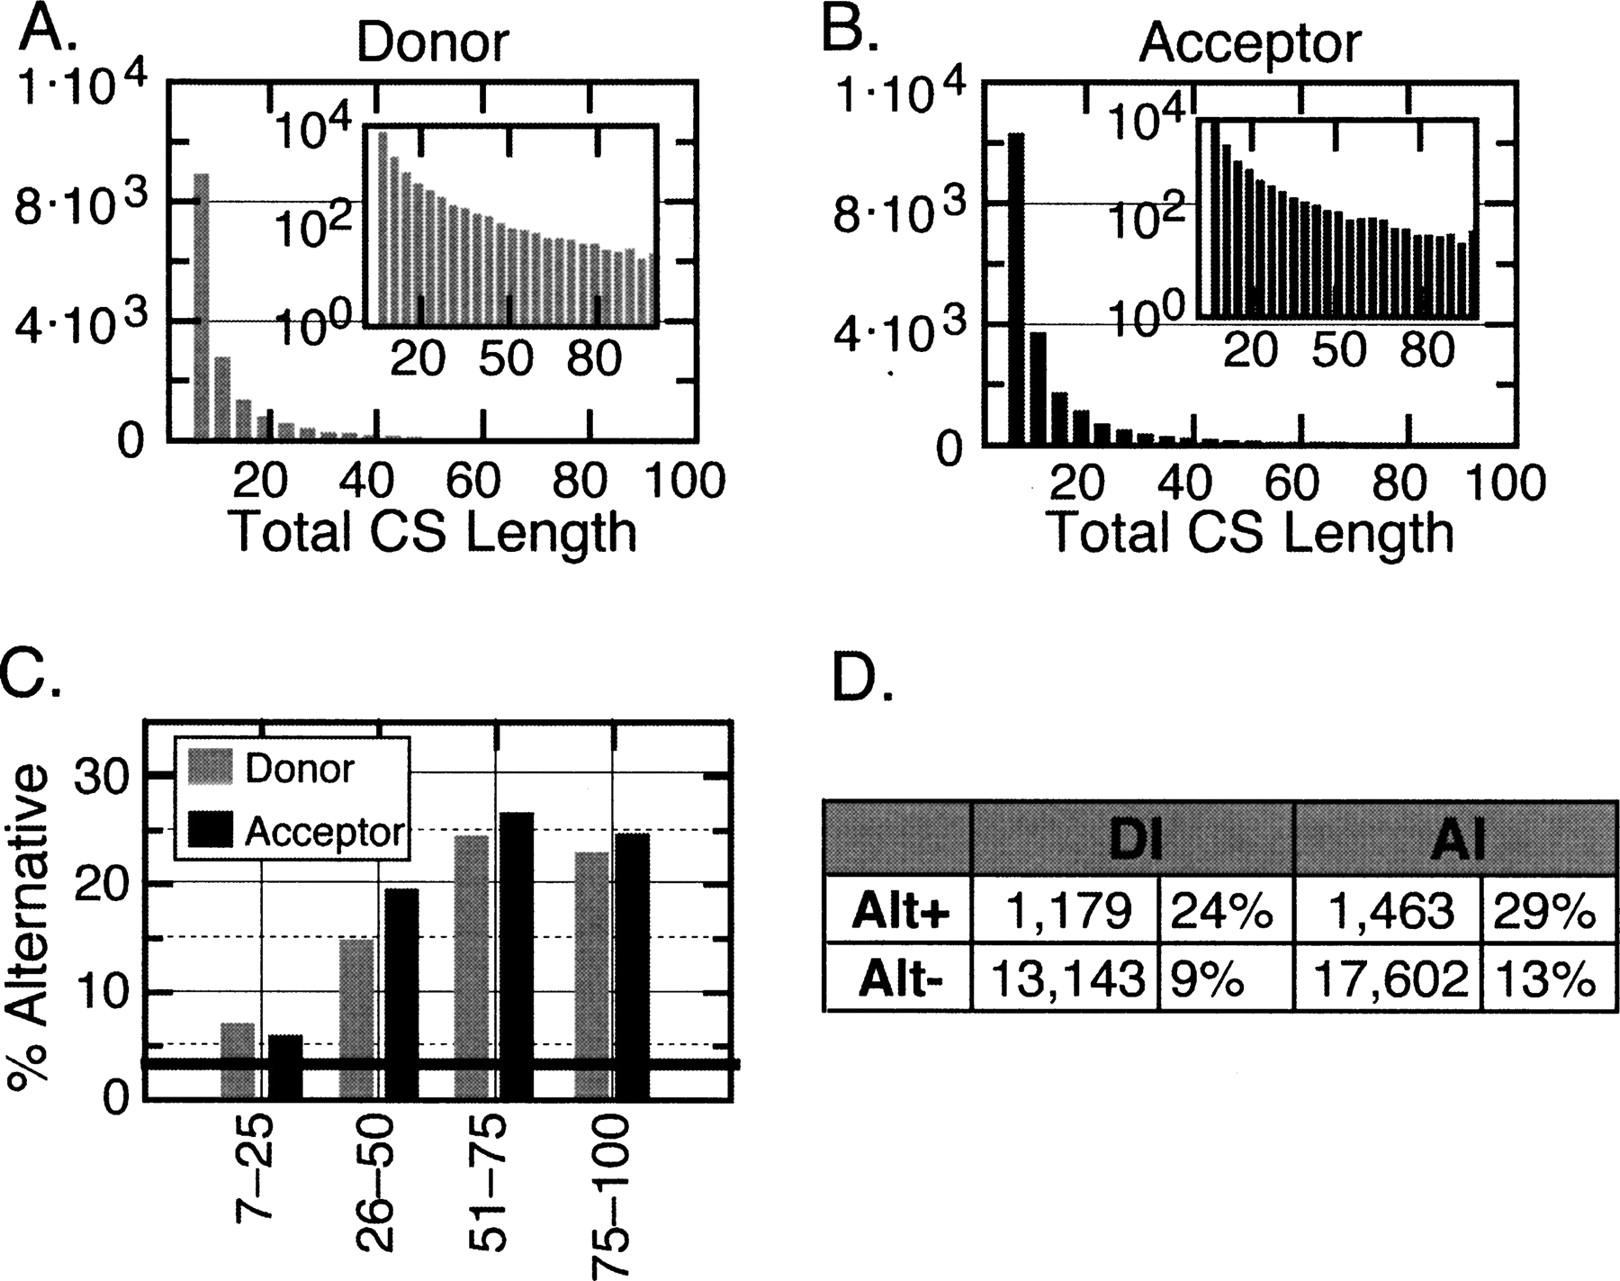
Distribution of total lengths of CSs found in donor and acceptor intronic regions and associations between CS length and alternative splicing. (A,B) Distributions of the lengths of the CSs found in the donor or acceptor intronic regions. In cases where more than one CS was found in a particular intron, the lengths were combined (total length). For each data set, the bin width is equivalent to two bases. The number of CSs in each bin is indicated along the Y-axis. The inset plots are the same data displayed using a log scaled Y-axis to better visualize the longer CSs. (C) The relationship between the percentage of introns that are alternatively spliced and the total length of CS found within the intron. The horizontal bar indicates the average percentage of splice-junctions that are alternatively spliced (3%). (D) The number (and corresponding percentages) of all alternatively spliced (Alt+) or constitutively spliced (Alt−) splice-junctions that contain a CS in the donor (DI) or acceptor (AI) intronic flanking sequence.


