
Table 1.
Comparison of alternative and constitutive splice-site scores
Click on table to view larger version.
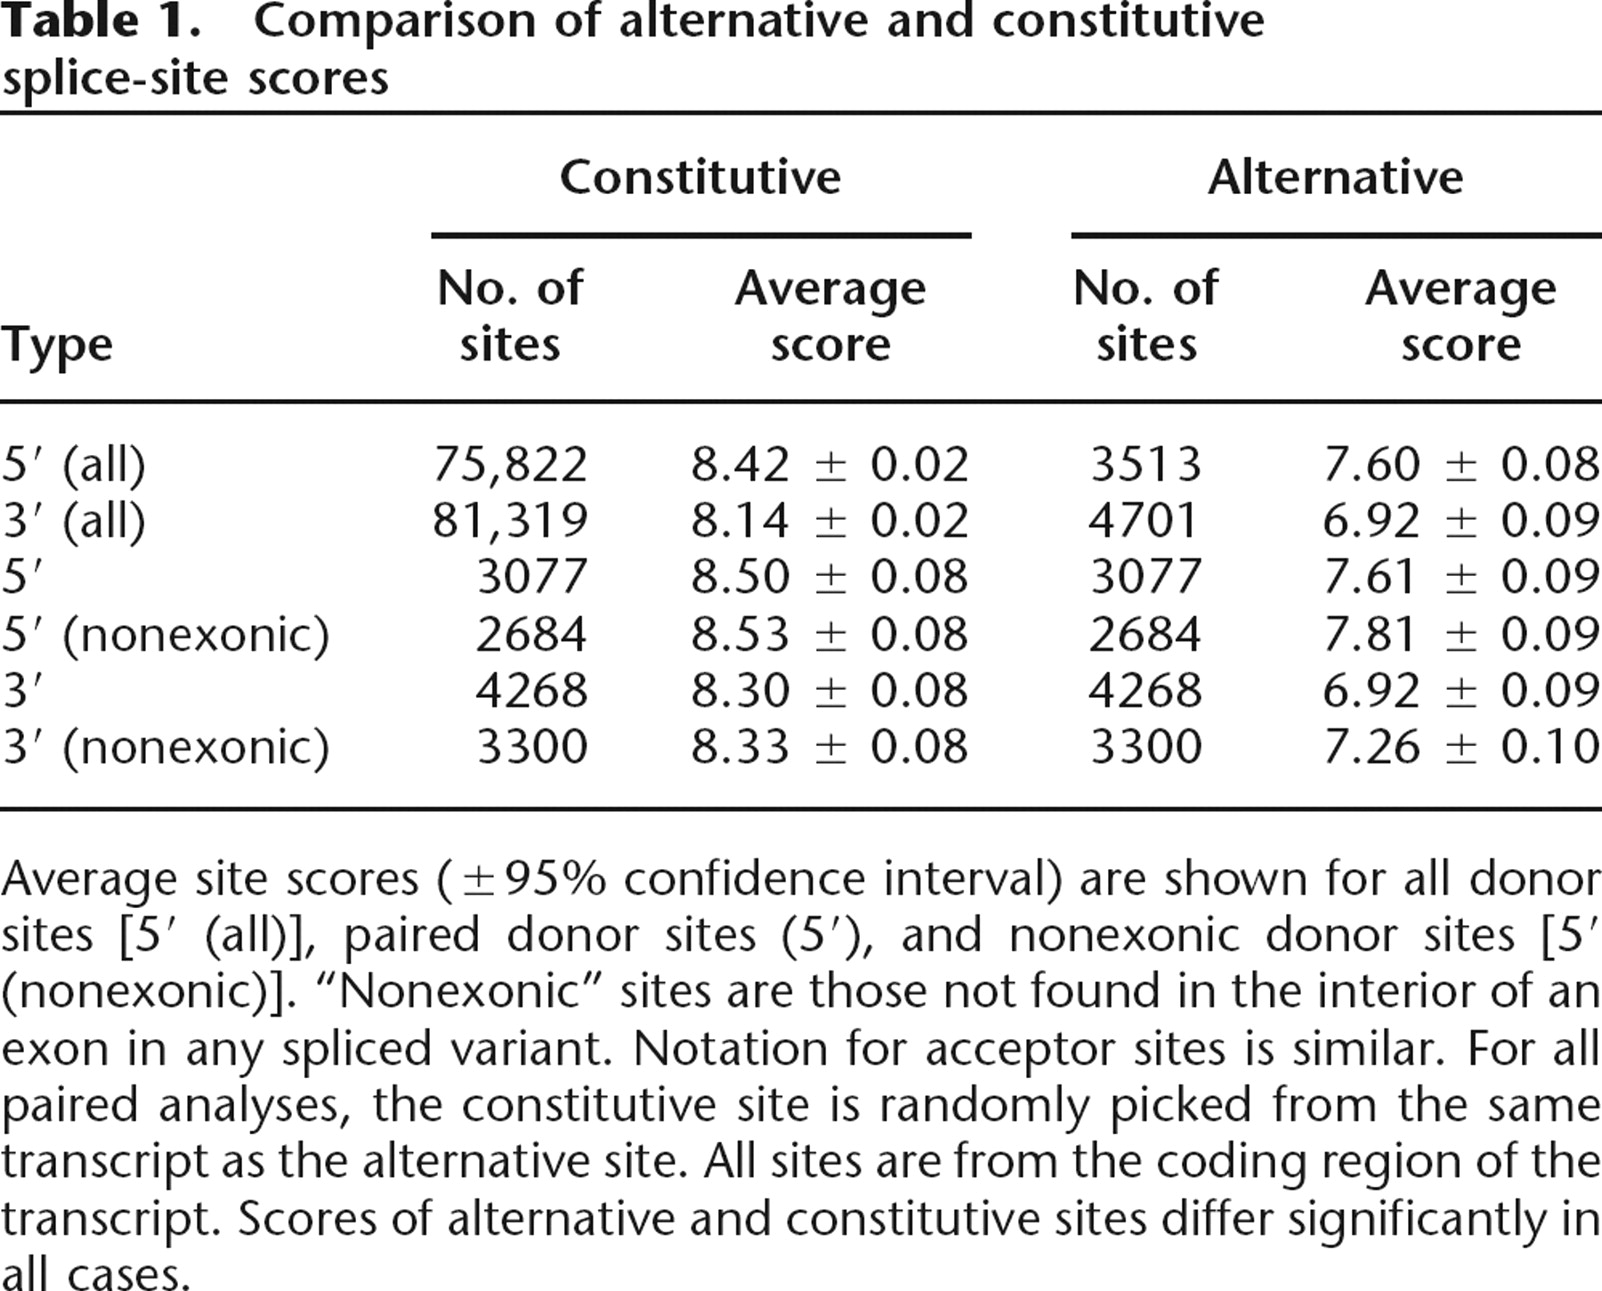
Average site scores (±95% confidence interval) are shown for all donor sites [5′ (all)], paired donor sites (5′), and nonexonic donor sites [5′ (nonexonic)]. “Nonexonic” sites are those not found in the interior of an exon in any spliced variant. Notation for acceptor sites is similar. For all paired analyses, the constitutive site is randomly picked from the same transcript as the alternative site. All sites are from the coding region of the transcript. Scores of alternative and constitutive sites differ significantly in all cases.


