
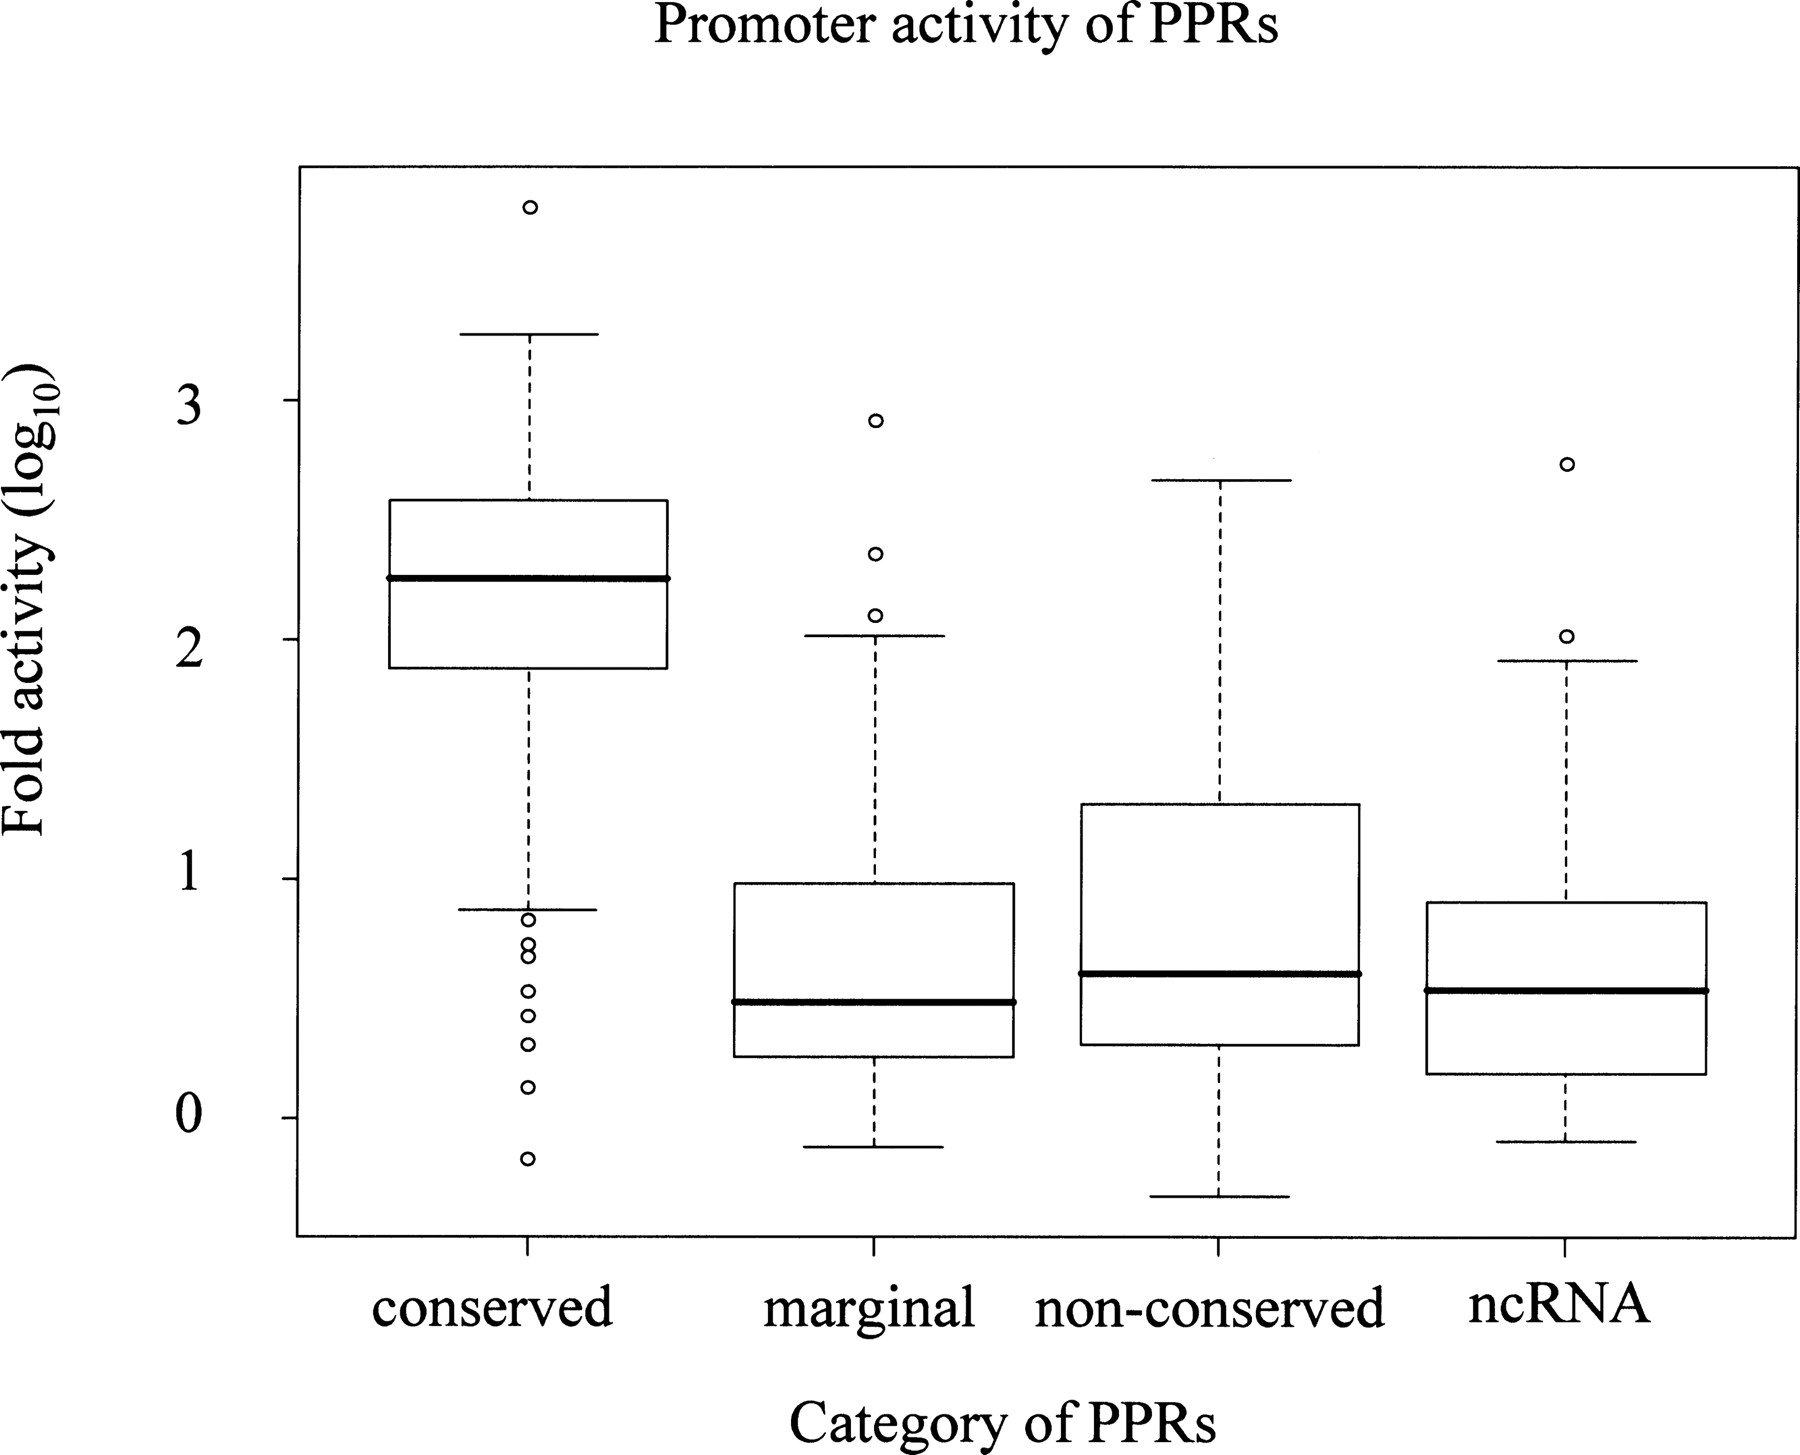
Figure 3.
Promoter activities of the “conserved” and “non-conserved” PPRs in HE293 cells. Distributions of the observed promoter activities are shown for each category of the PPRs. The activities are shown on a log scale with a base of 10. The average promoter activity found for 250 random genomic fragments was designated as 1 (log 0).


