
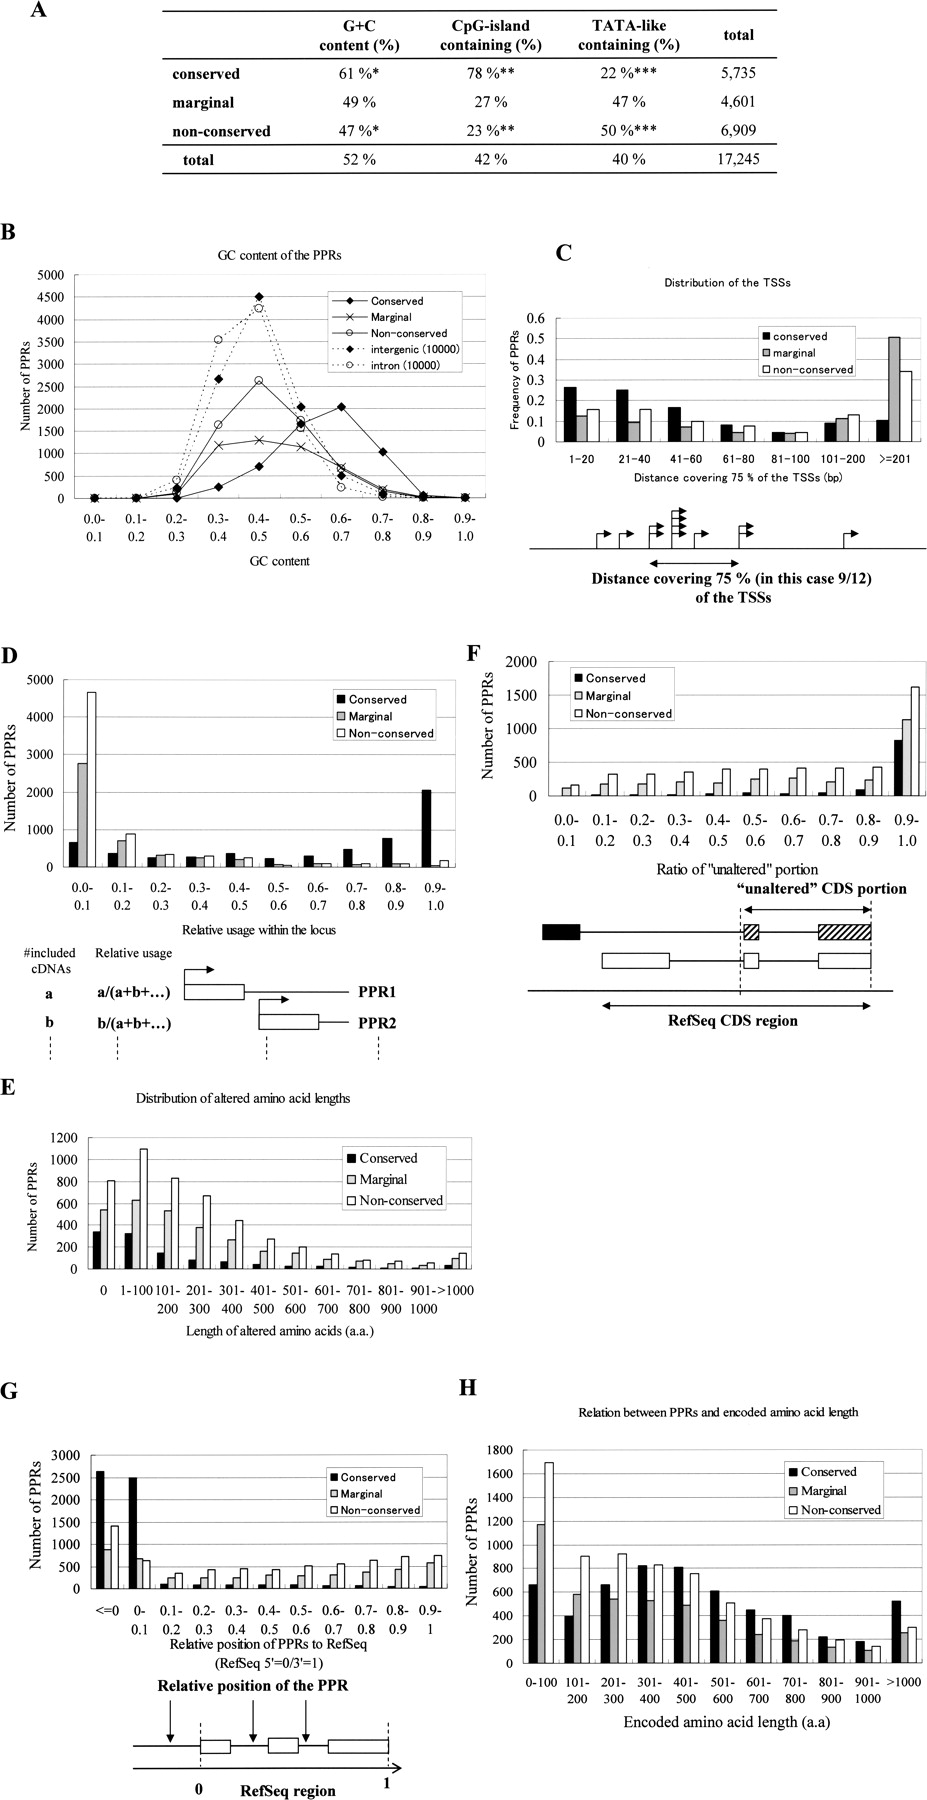
Characteristic features of conserved and “non-conserved” PPRs. (A) Frequencies of CpG islands and TATA boxes and overall G+C content in each category of PPRs. The statistical significances of the differences in the frequencies between “conserved” and “non-conserved” at the indicated positions are all P < 1.0 × −100 (*: t-test; ** and ***: χ2 test). (B) Distribution of the G+C contents. What the lines represent is shown in the inset. (C) Distance covering 75% of the TSSs (X-axis) was examined for each category of the PPRs. Frequency of the PPRs (Y-axis) belonging to each population is shown. (D) Number of PPRs which were used at the indicated relative frequencies (judged from the included cDNA numbers) is shown. (E) Number of PPRs which alter indicated length of the amino acids is shown. (F) Number of PPRs which alter indicated portion (ratio) of the amino acids is shown. (G) Number of PPRs that are located at the indicated position relative to RefSeq is shown. The relative position was designated as RefSequation 5′-end = 0 and RefSequation 3′-end = 1. Note that a minus value indicates a position upstream of the 5′-end of the RefSeq. (H) The number of PPRs which produce transcripts encoding amino acids of the indicated length. Schematic representations of the definitions of the X-axes are shown in the bottom margins for C, D, F, and G.


