
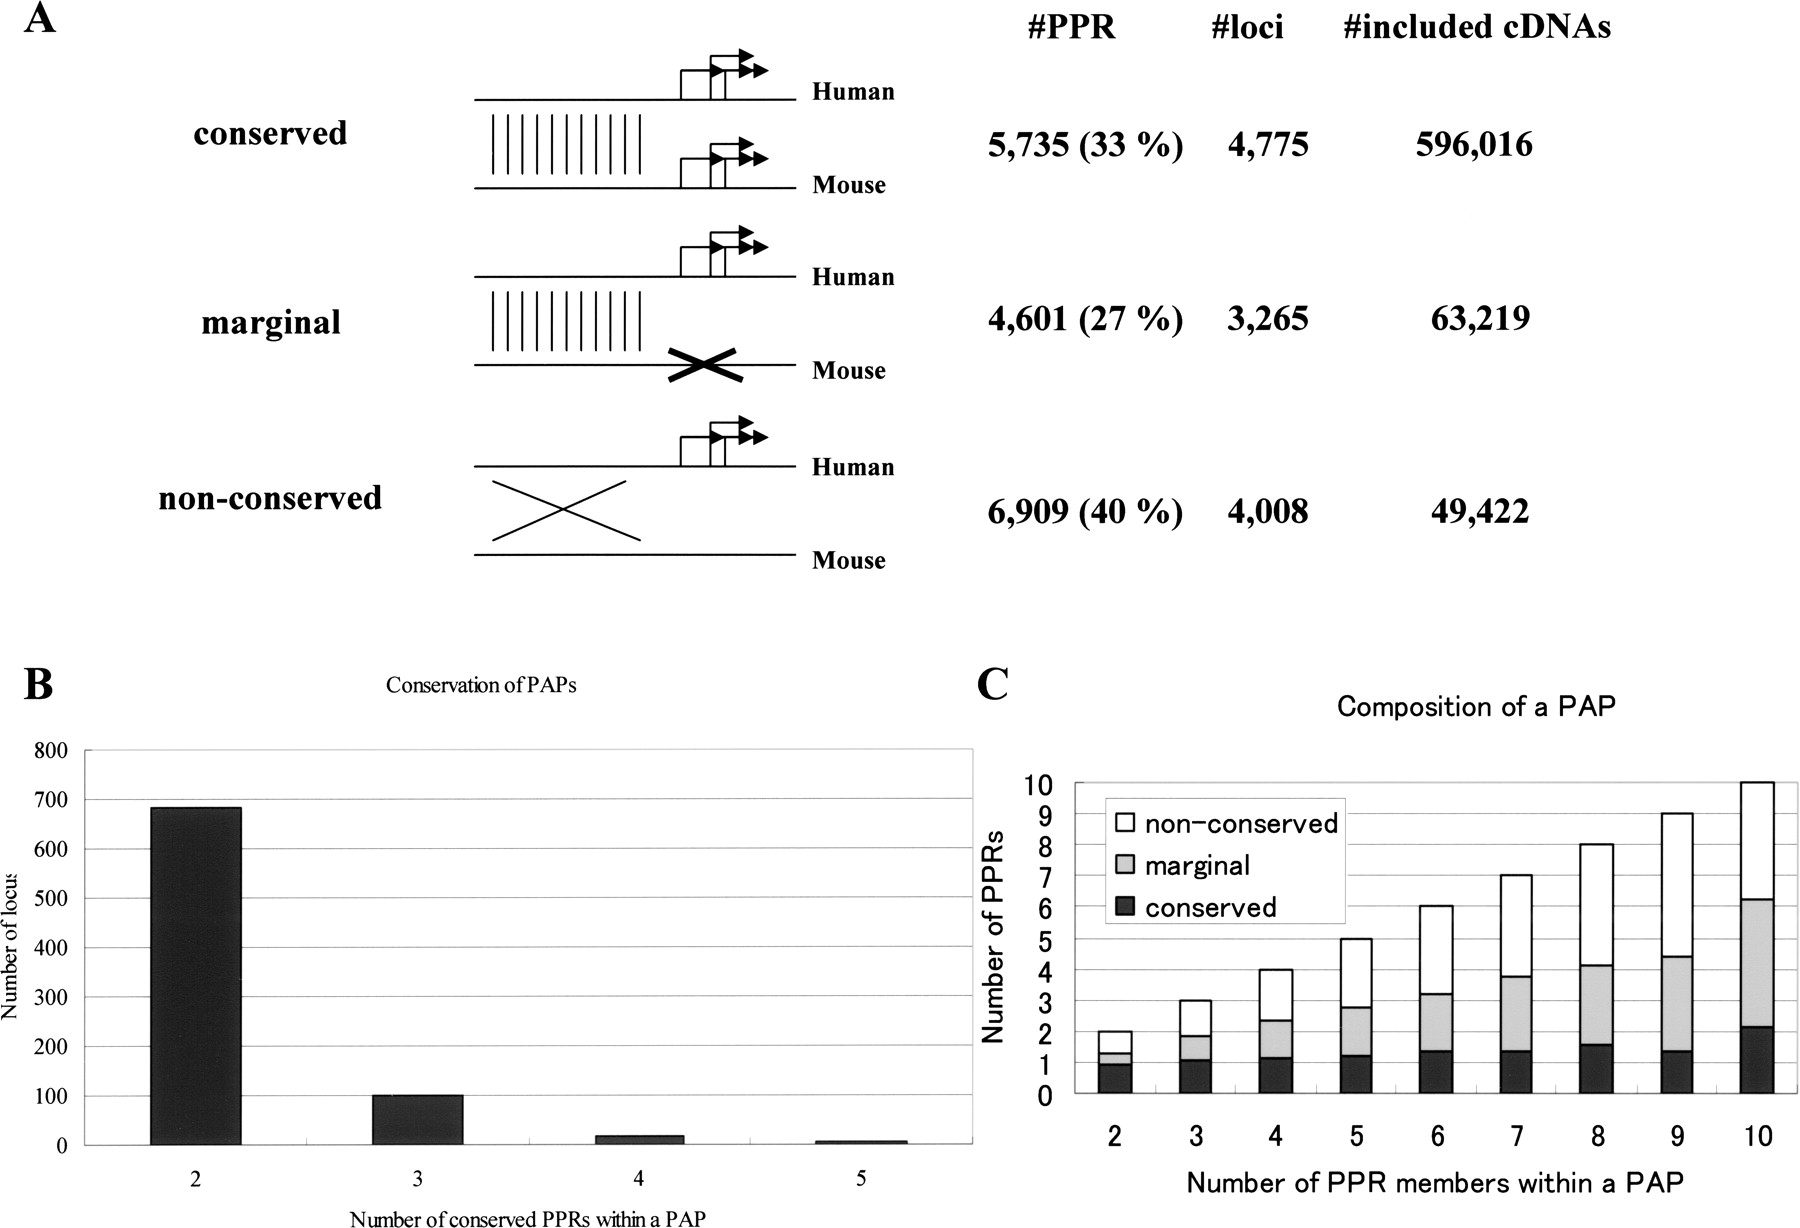
Evolutionary conservation of PAPs. (A) Patterns of evolutionary conservation and the number of PPRs belonging to each of the categories. Lines and arrows show the genomic sequence and mapped positions of the TSSs, respectively. Alignable regions are indicated as regions connected by vertical lines. For details, also see the text. (B) Number of loci in which the indicated number of PPR members are “conserved.” (C) Composition of the PAP in terms of average numbers of “conserved,” “marginal,” and “non-conserved” PPRs. When a PAP is consisted of the indicated number of PPR members (X-axis), how many of the PPRs are “conserved” (solid bar), “marginal” (gray bar), or “non-conserved” (white bar) on average are shown.


