
Table 1.
Descriptive statistics for the three categories of Non-GENCODE ESTs
Click on table to view larger version.
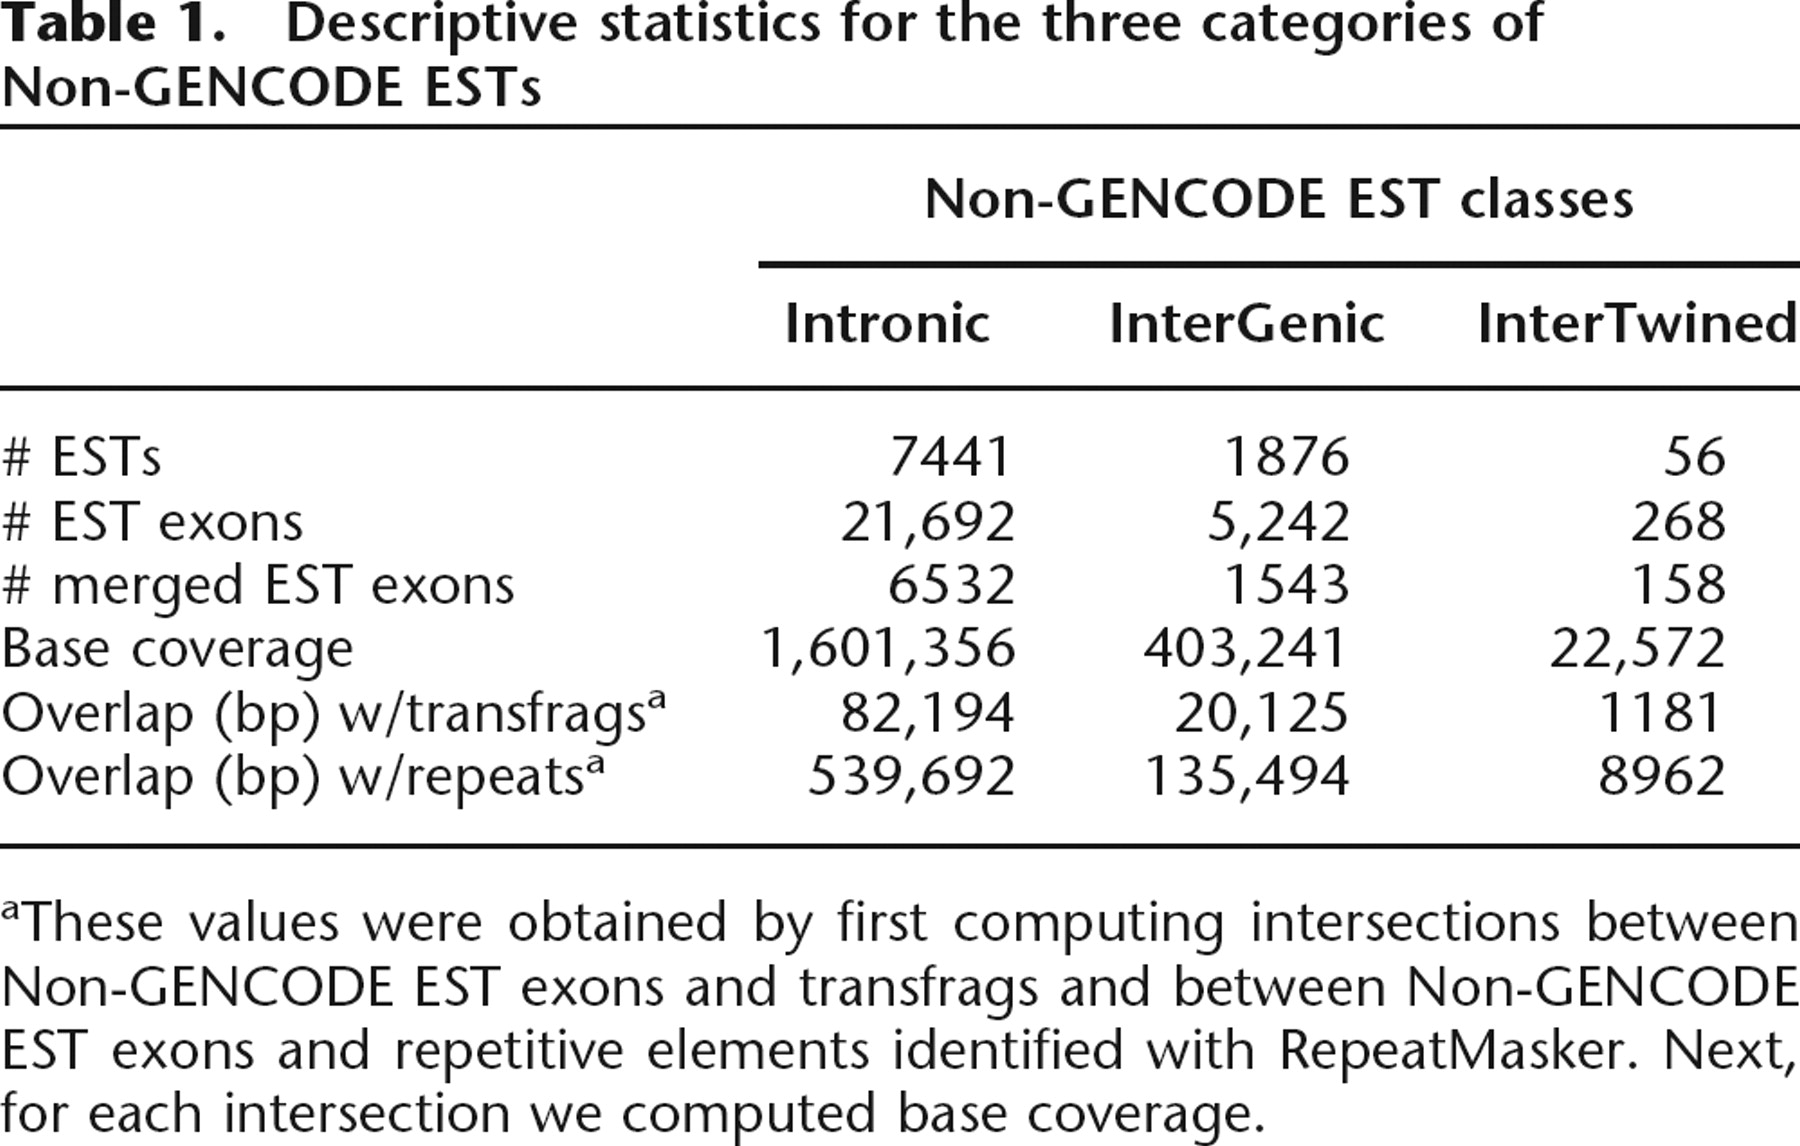
aThese values were obtained by first computing intersections between Non-GENCODE EST exons and transfrags and between Non-GENCODE EST exons and repetitive elements identified with RepeatMasker. Next, for each intersection we computed base coverage.


