
Table 1.
Correlation between predicted and experimental cleavage patterns
Click on table to view larger version.
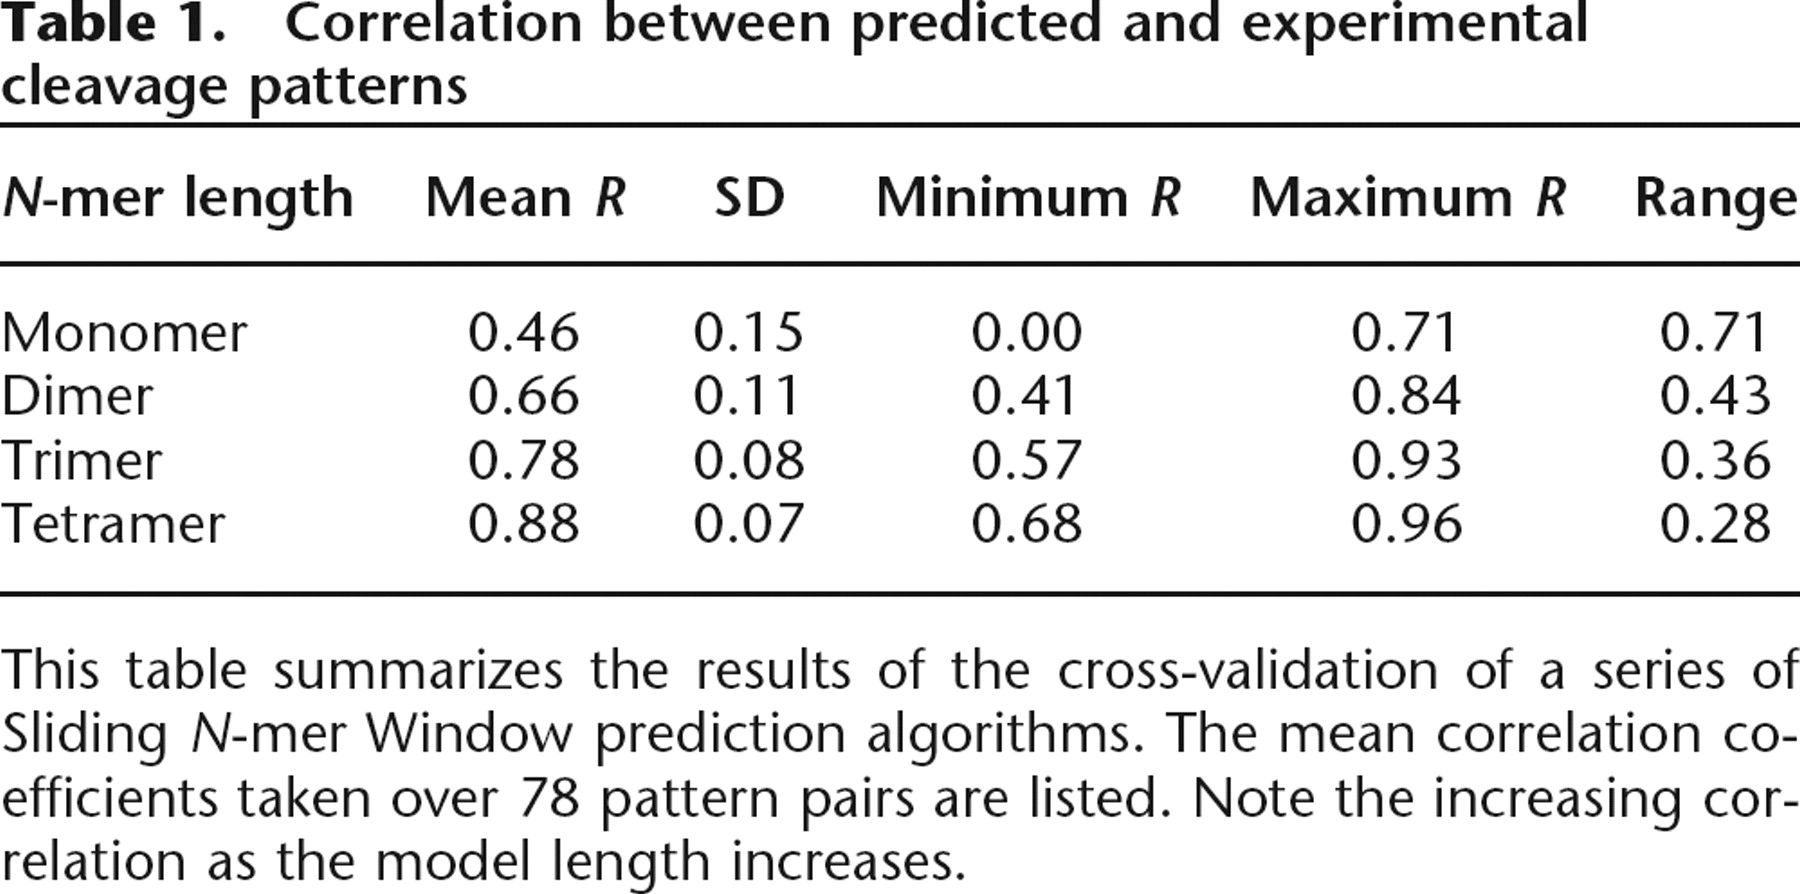
This table summarizes the results of the cross-validation of a series of Sliding N-mer Window prediction algorithms. The mean correlation coefficients taken over 78 pattern pairs are listed. Note the increasing correlation as the model length increases.


