
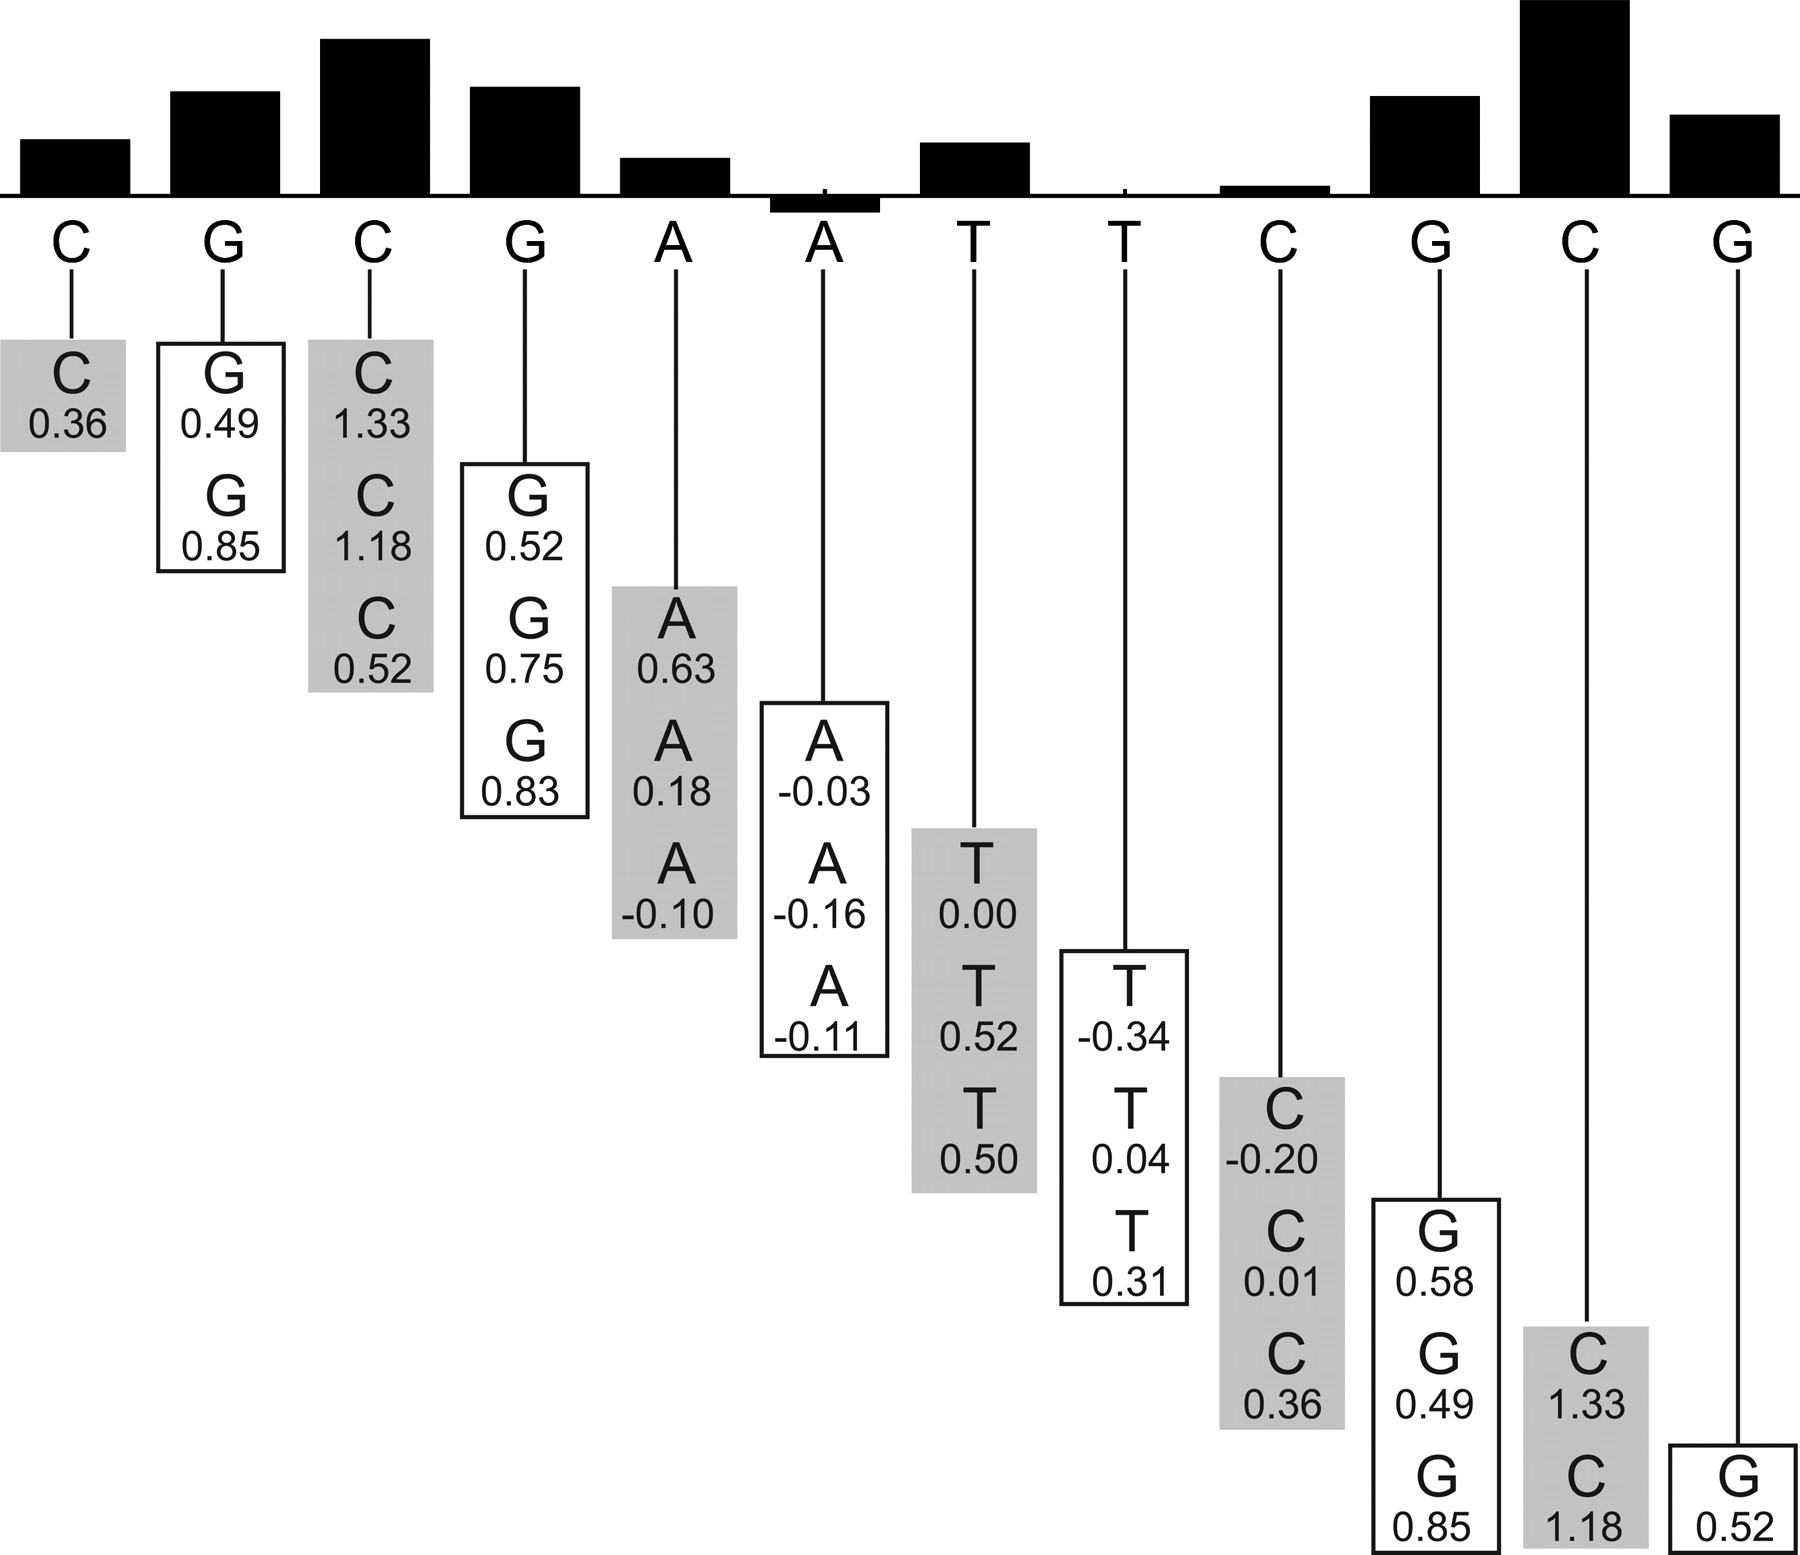
Figure 5.
Sliding trimer window algorithm. The sequence to be predicted is shown below the bar graph. It is divided into overlapping trinucleotides. The hydroxyl radical cleavage intensity data for each trimer are retrieved from the ORChID database and are listed below each nucleotide. The values in each column are averaged to produce a predicted hydroxyl radical cleavage intensity, which is represented as a bar at the top. Note that the two terminal nucleotides at each end rely on data from only one or two trinucleotides, rather than three.


