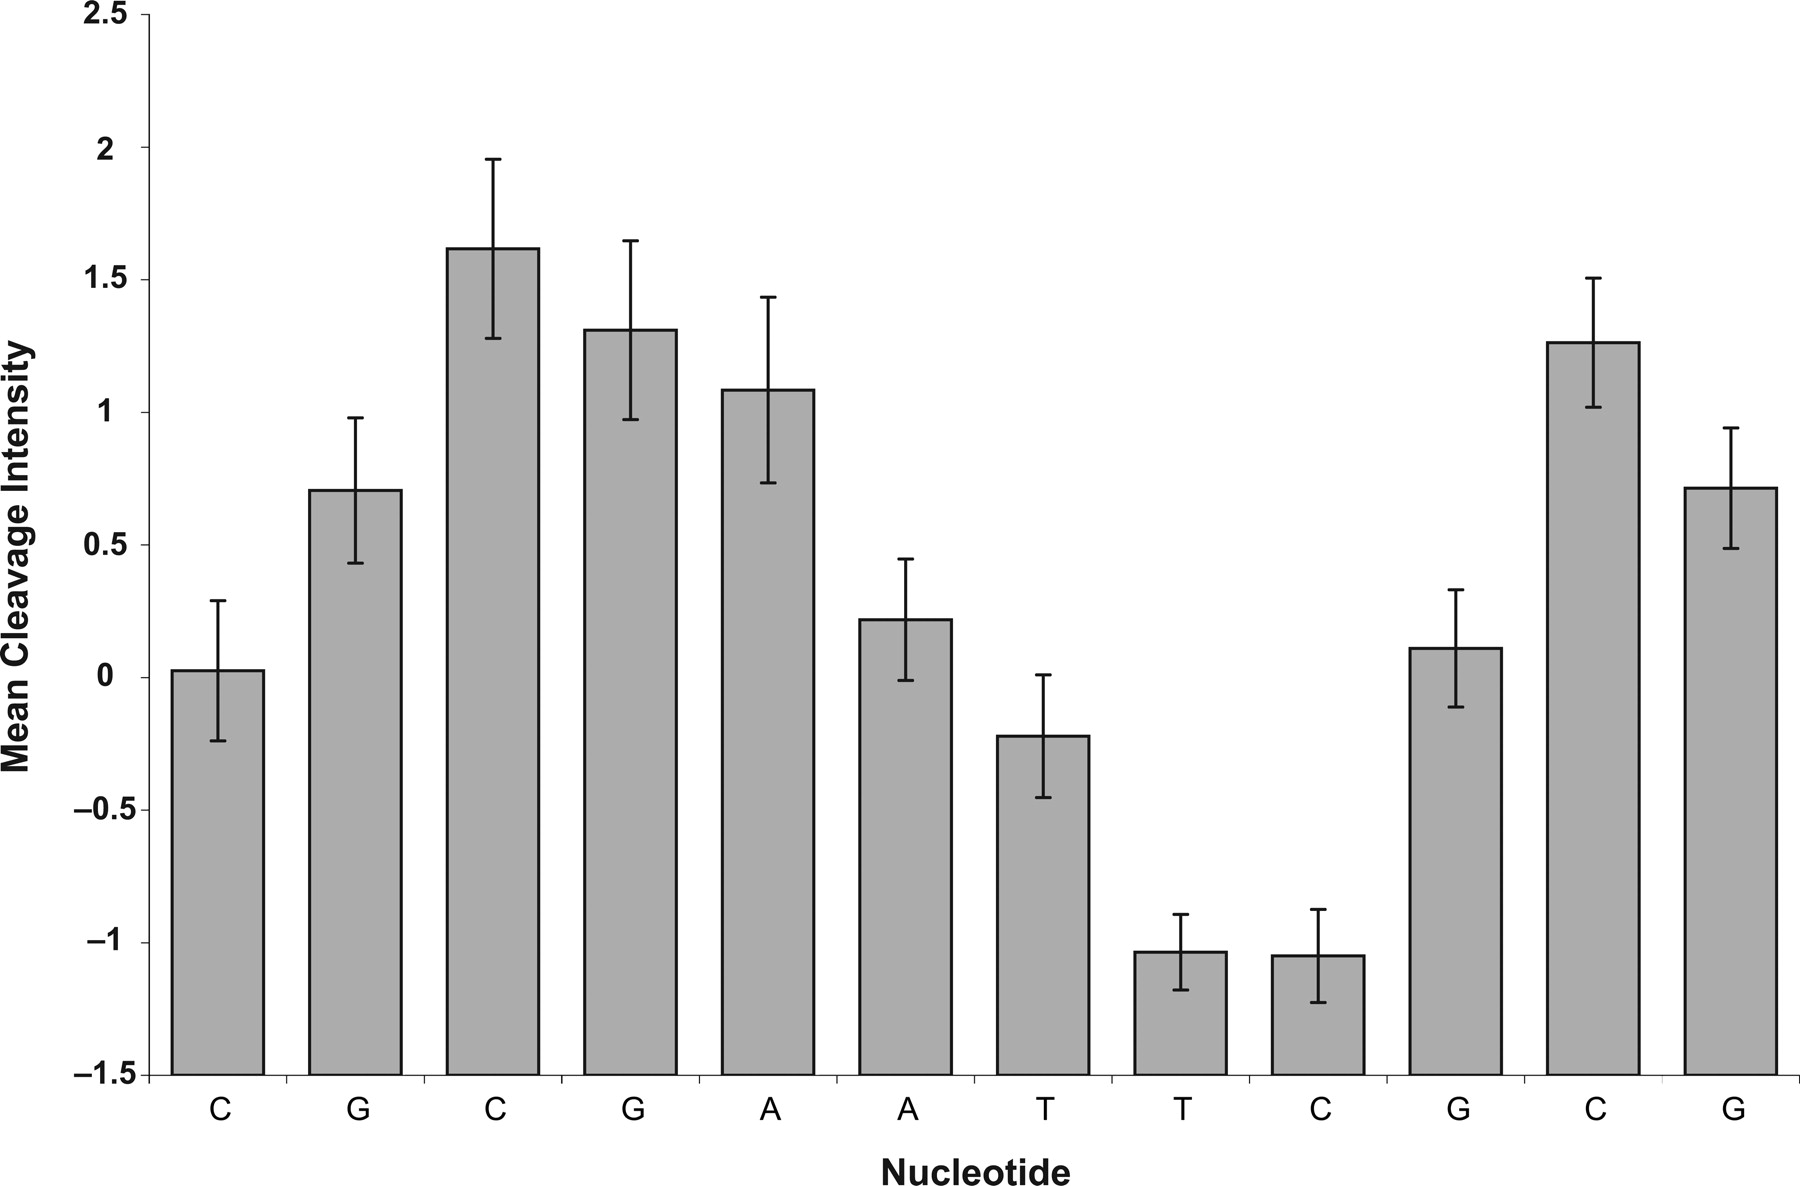
Construction of a genome-scale structural map at single-nucleotide resolution

(Downloading may take up to 30 seconds. If the slide opens in your browser, select File -> Save As to save it.)

Click on image to view larger version.

Figure 2.
Figure 2.

Reproducibility of the cleavage pattern of the common flanking sequence (see Fig. 1). The mean cleavage intensities, taken from 112 instances of the common flanking sequence cleavage pattern, are plotted as bars, with standard deviations shown as error bars.

This Article

  1. Genome Res. 17: 947-953

Preprint Server