
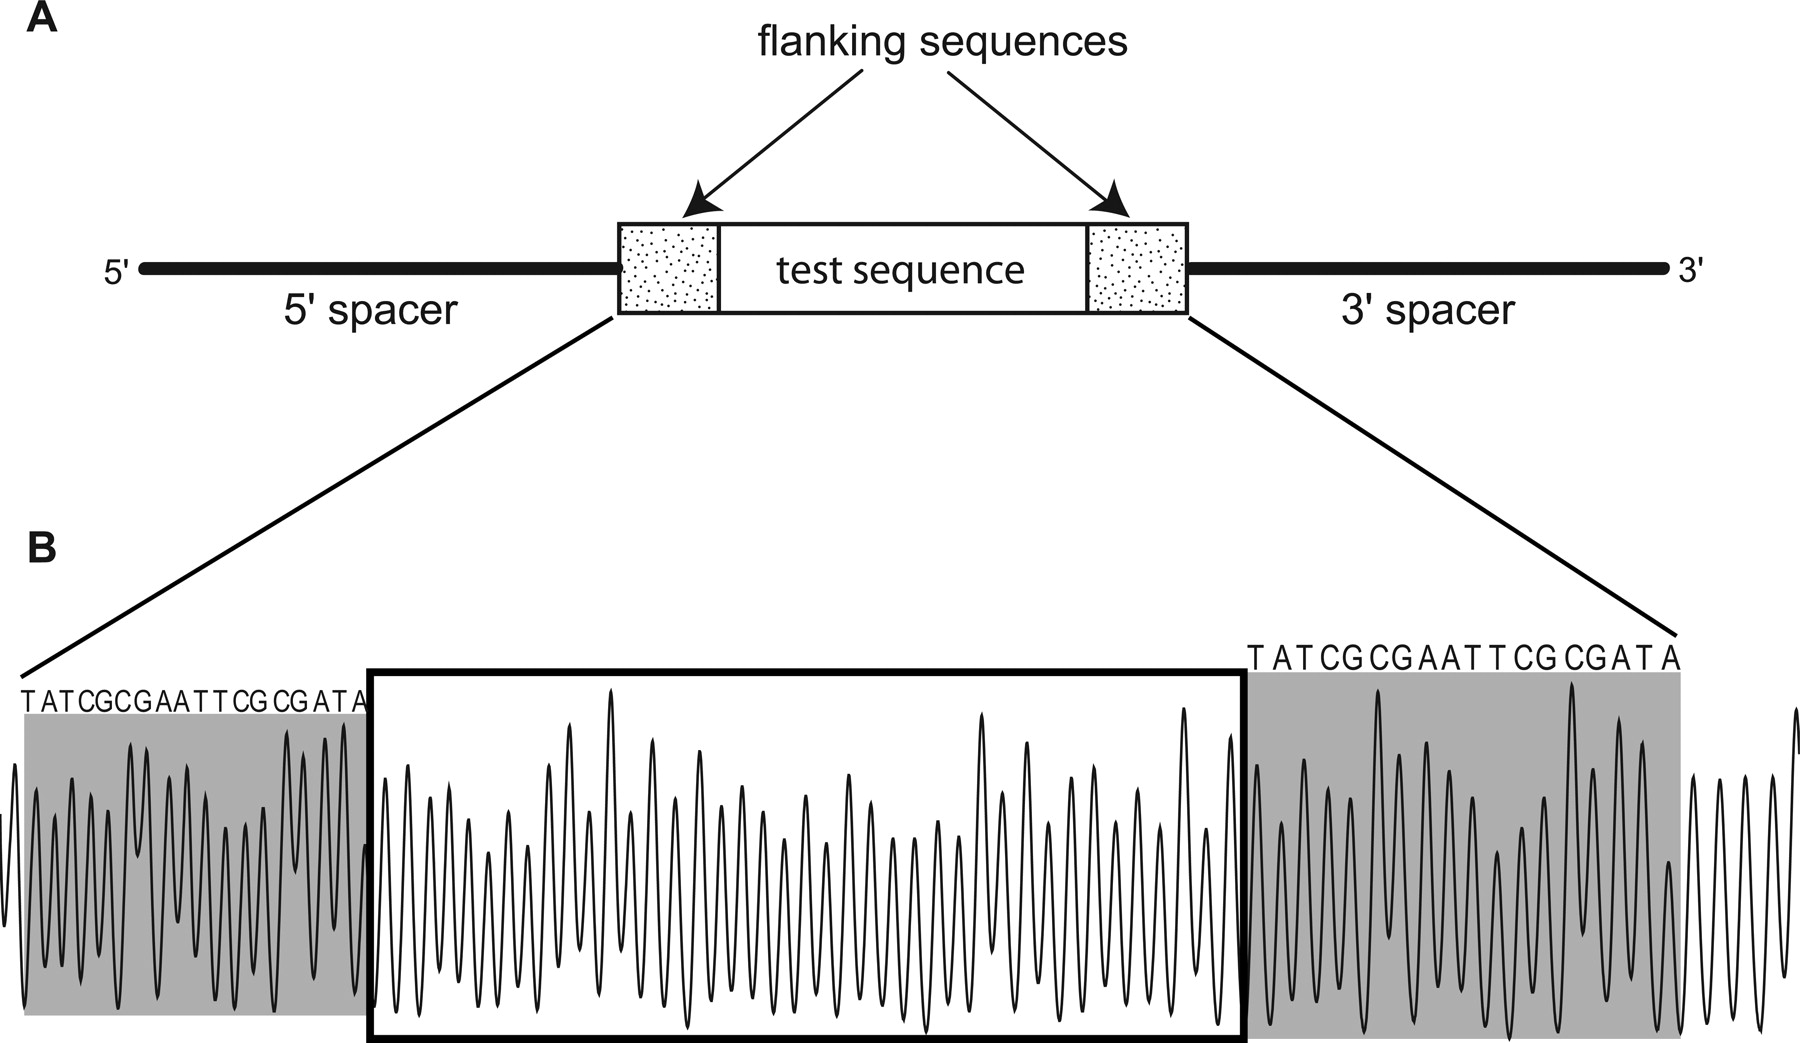
(A) Design of the DNA molecules used to construct the R40 library. The test sequence (an insert of 40 random nucleotides) is located near the center of the DNA strand, flanked by common sequences on both sides. The pentamer library was constructed in a similar manner, with individual pentamer sequences (see Supplemental Fig. S1) serving as the test sequence. (B) Typical electropherogram of a sample from the R40 library. The R40 test sequence is boxed, and the common flanking sequences are shaded. Each peak in the pattern represents cleavage by the hydroxyl radical at one nucleotide of the DNA molecule. The area of a peak is proportional to the extent of cleavage at that nucleotide (Shadle et al. 1997). Note that the cleavage patterns of the common palindromic flanking sequences at the 5′ (left) and 3′ (right) ends are similar for a particular member of the library. This also holds true for different library members (data not shown).


