
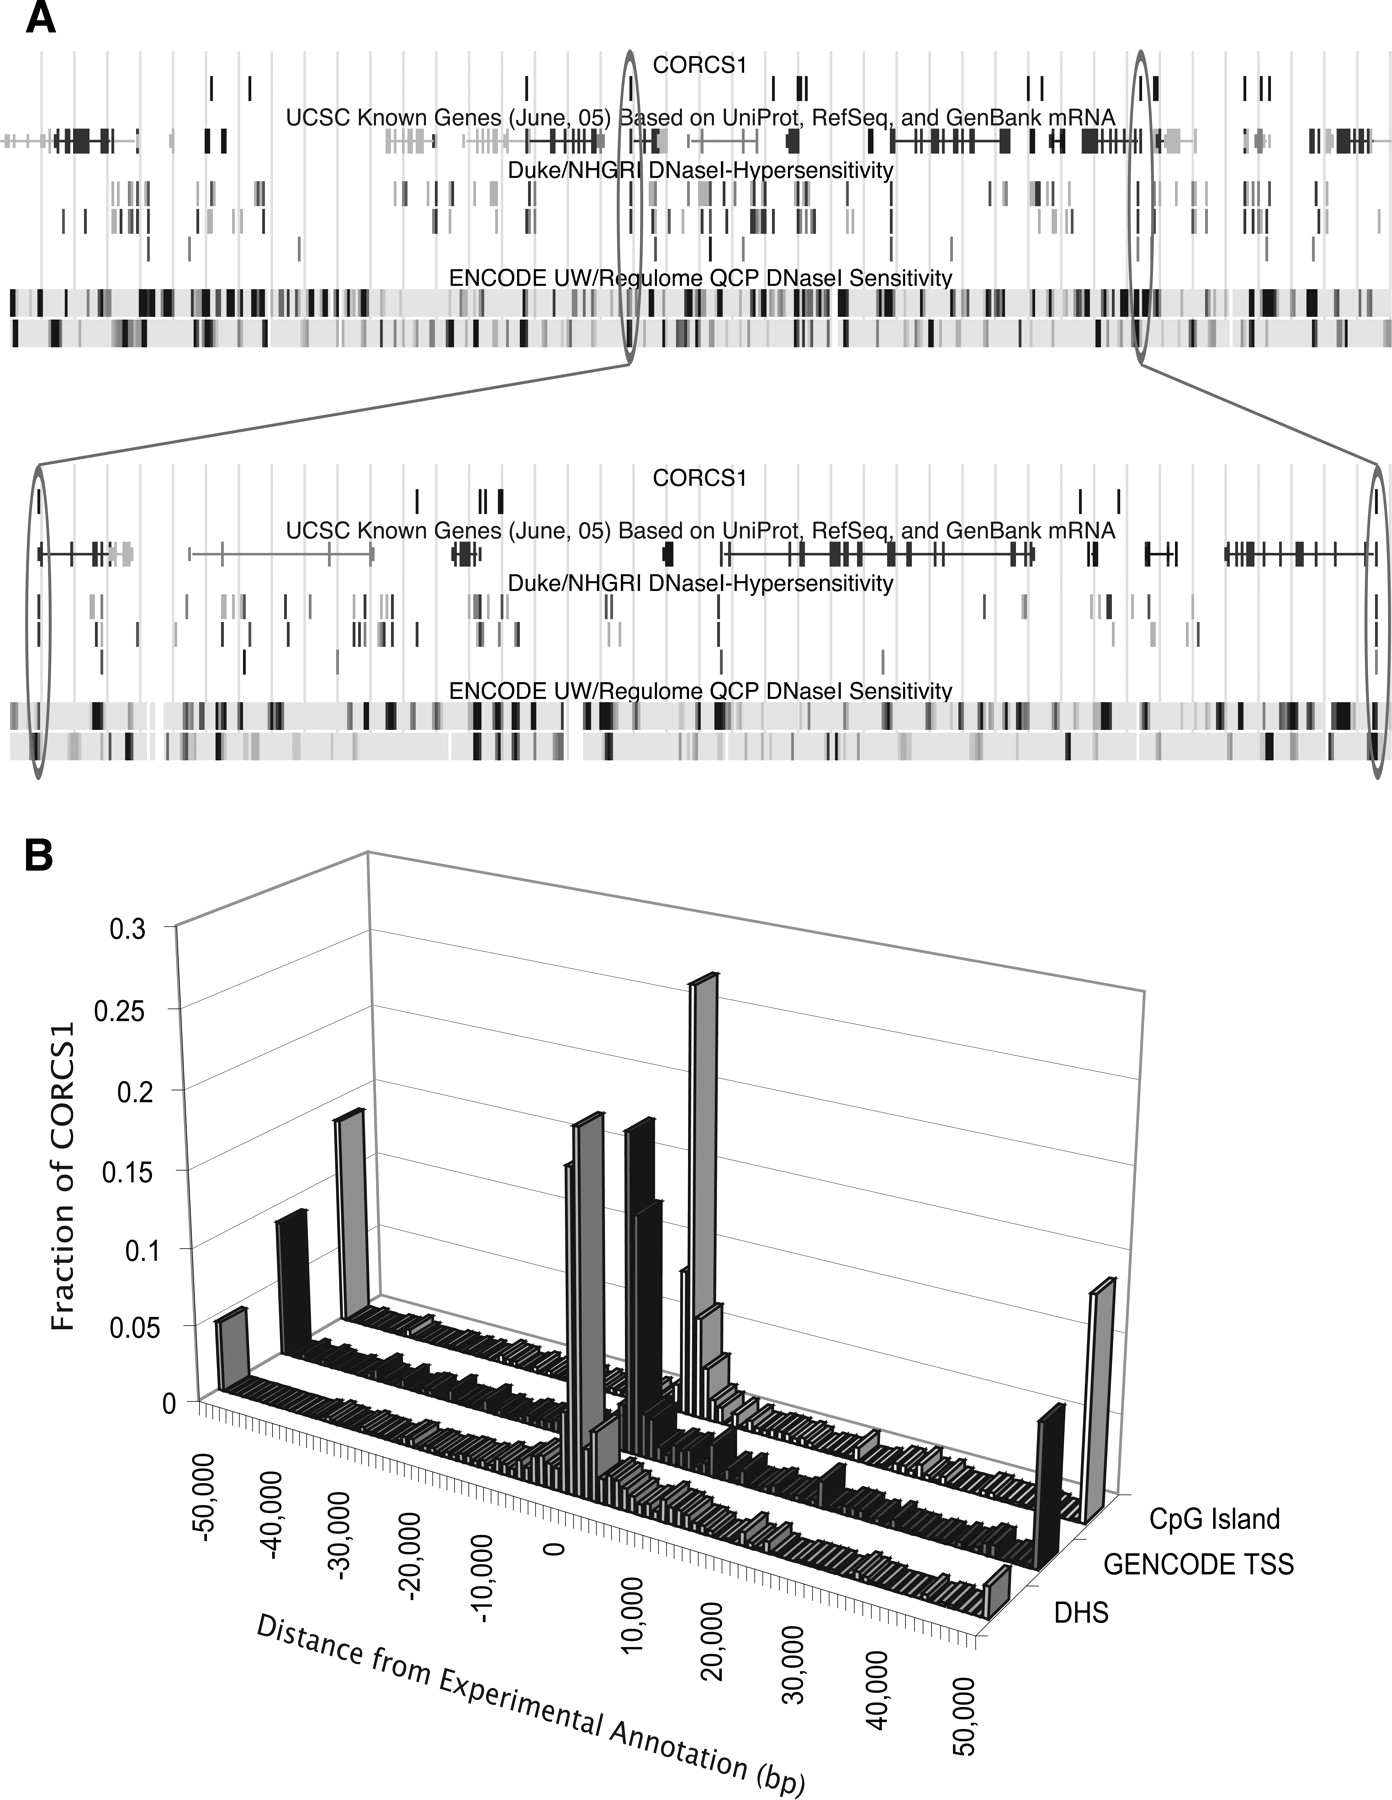
Location of CORCS1 sites relative to experimental annotations. (A) UCSC Genome Browser shot of CORCS1 in ENCODE region ENm002. Data types are indicated by labels above each track. For the NHGRI DHSs, the top, middle, and bottom tracks correspond to GM06990 (DNase-Chip method), CD4+ T cells (DNase-chip method), and CD4+ T cells (MPSS method), respectively. The latter data set was the training set for discovering CORCS1. For the UW/Regulome DHSs, the upper and lower tracks contain data from the GM06990 cell line and the SKNSH cell line, respectively. (Below) A segment of the browser shot is expanded to highlight a few examples. The oval on the right indicates a CORCS1 site that aligns with a DHS that was discovered by three different methods in three different cell lines. The oval on the left indicates a CORCS1 site that aligns with a DHS that is not in the training set. (B) Clustering of CORCS1 near experimental annotations. The distance (in base pairs) of each of the 588 CORCS1 sites to the nearest experimental annotation was measured. The three histograms show that CORCS1 clusters near annotated DHSs, TSSs, and CpG islands.


