
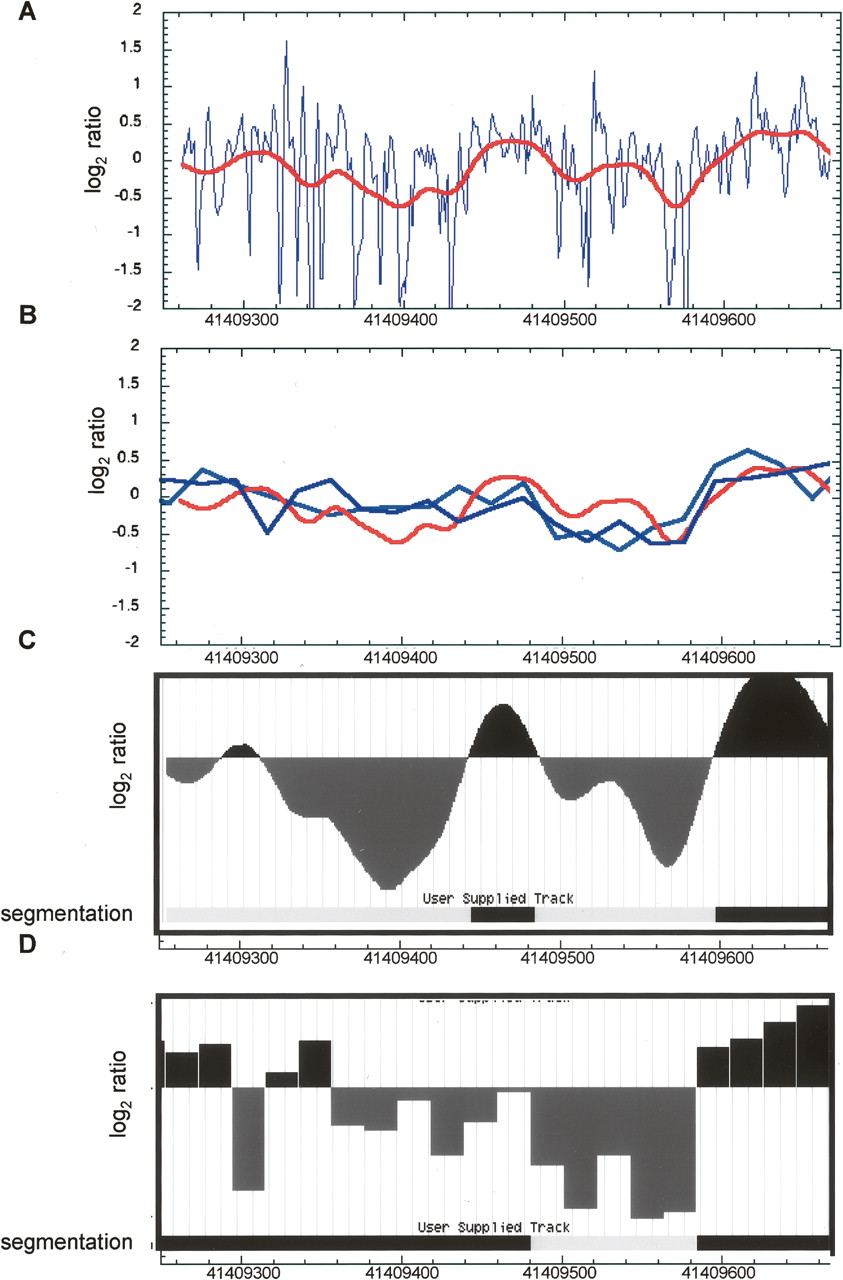
Smoothed log2(intensity ratio [B/N]) for LCMT2 primer extension and comparison with microarray data. (A) Data points in blue show the log2(intensity ratio [B/N]) of the mean intensities for each trace. The red line is a smoothed curve from a Gaussian window length of 75 and a standard deviation of 15 bases. (B) The smoothed primer extension curve in red (scale modified from that shown in panel A to show detail) is overlaid on the microarray data, which is shown as log2(intensity ratio[N/B]). Note that the primer extension curves show the ratio as [B/N], while the microarray curves are shown as the ratio [N/B]; by plotting the data this way, a “high” region implies protection from cleavage in both cases. The light blue trace and the dark blue trace represent the average of the three replicate forward probes and the three replicate reverse probes, respectively. (C, D) These data were further segmented into two states—“accessible,” shown in black, and “inaccessible,” shown in white—using a HMM. A HMM was trained on the log2intensity ratio signal for the smoothed primer extension data (C) or the microarray reverse strand data (D) for the purposes of comparison. The data traces in C are identical to those shown in B. The bar below each data trace shows the segmentation of the data.


