
Table 2.
Concordance between segmentations of individual data types
Click on table to view larger version.
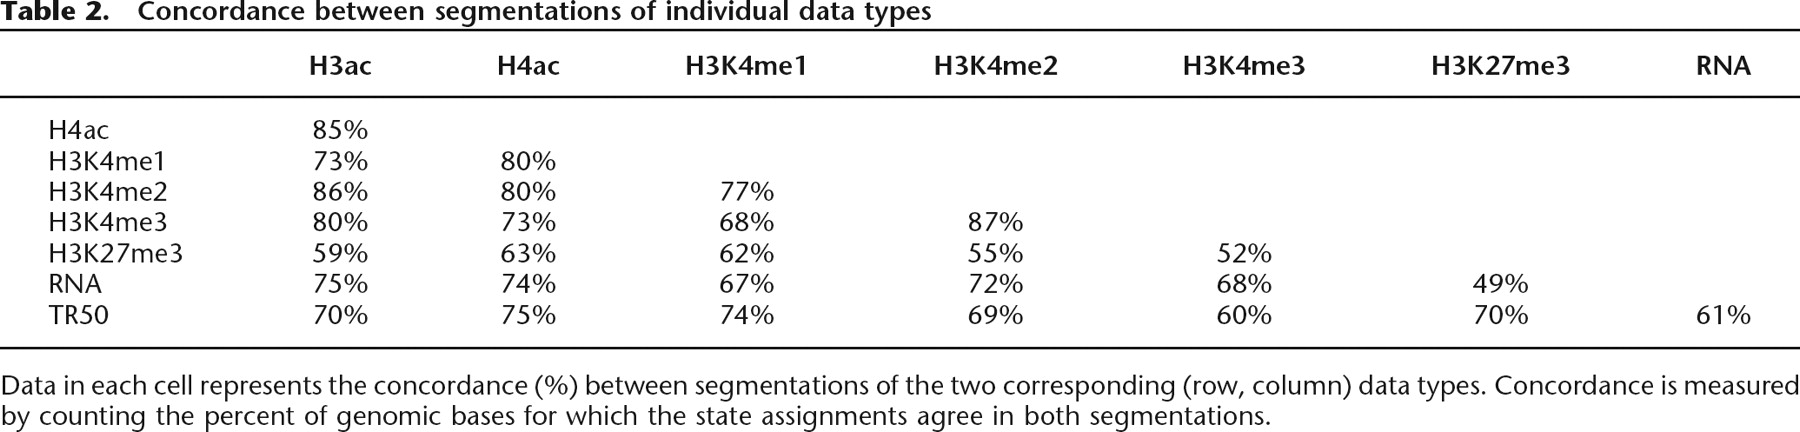
Data in each cell represents the concordance (%) between segmentations of the two corresponding (row, column) data types. Concordance is measured by counting the percent of genomic bases for which the state assignments agree in both segmentations.


