
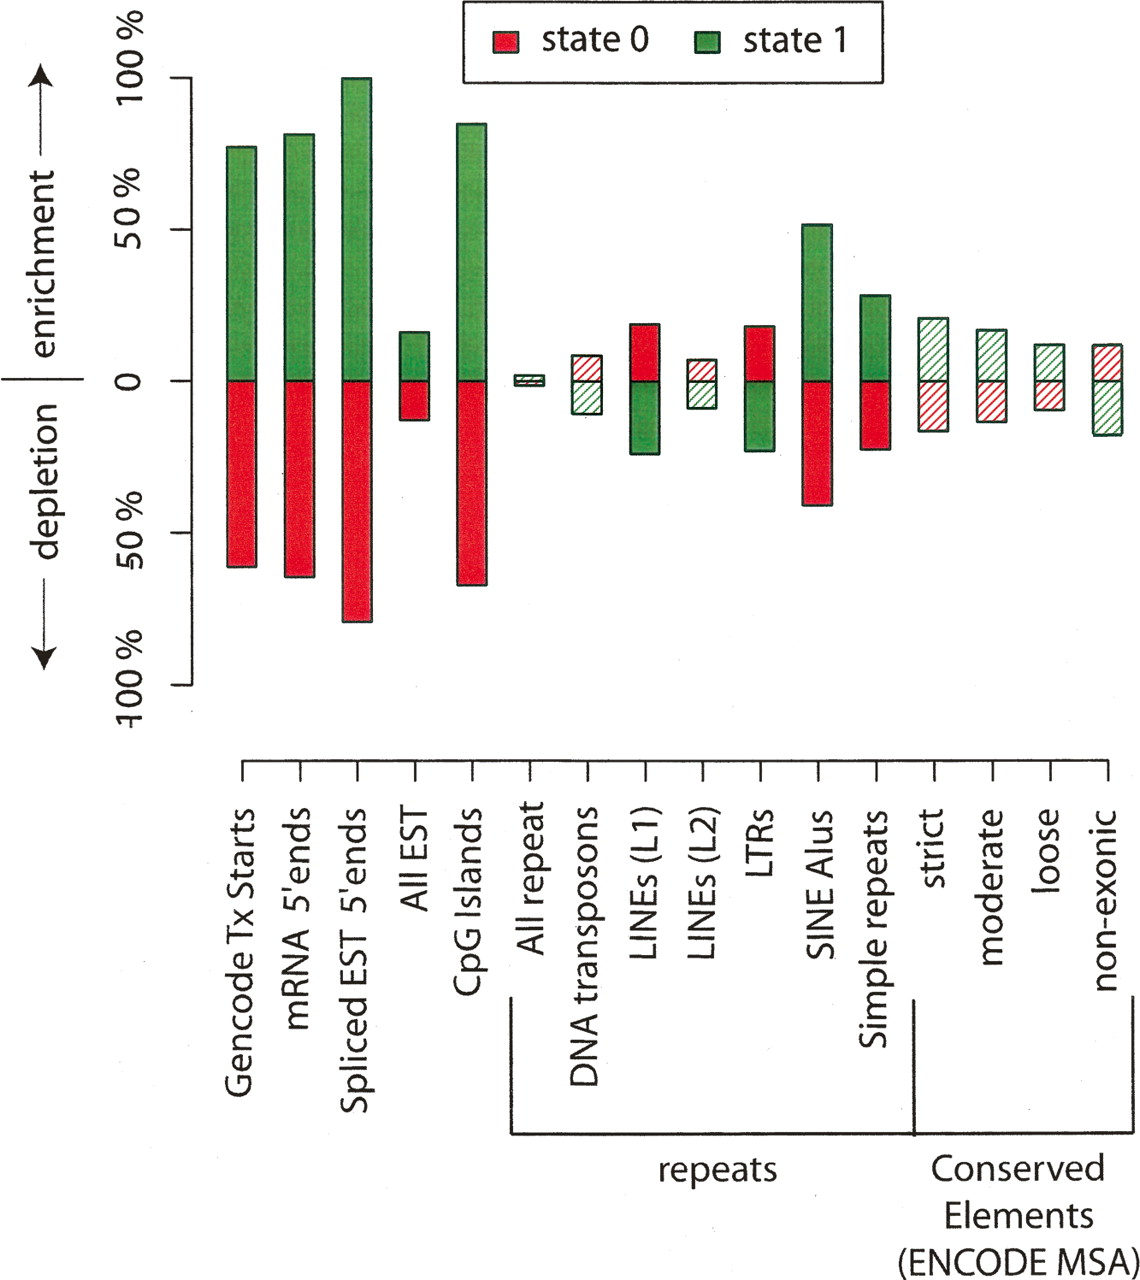
Enrichment and depletion of annotated genomic features in active and repressed domains. Data are based on simultaneous segmentation of four data types (H3ac, H3K27me3, RNA, TR50). Green bars correspond to active state regions, red bars to repressed regions. Values (Y axis) indicate percentage enrichment or depletion over random expectation. For example, GENCODE TxStarts are ∼71% enriched over expectation in active regions and ∼61% depleted under expectation in repressed regions (see Table 4 for corresponding data). Shaded bars reflect enrichment or depletion that is not significant at the 0.01 level based on the label permutation test (see Methods).


