
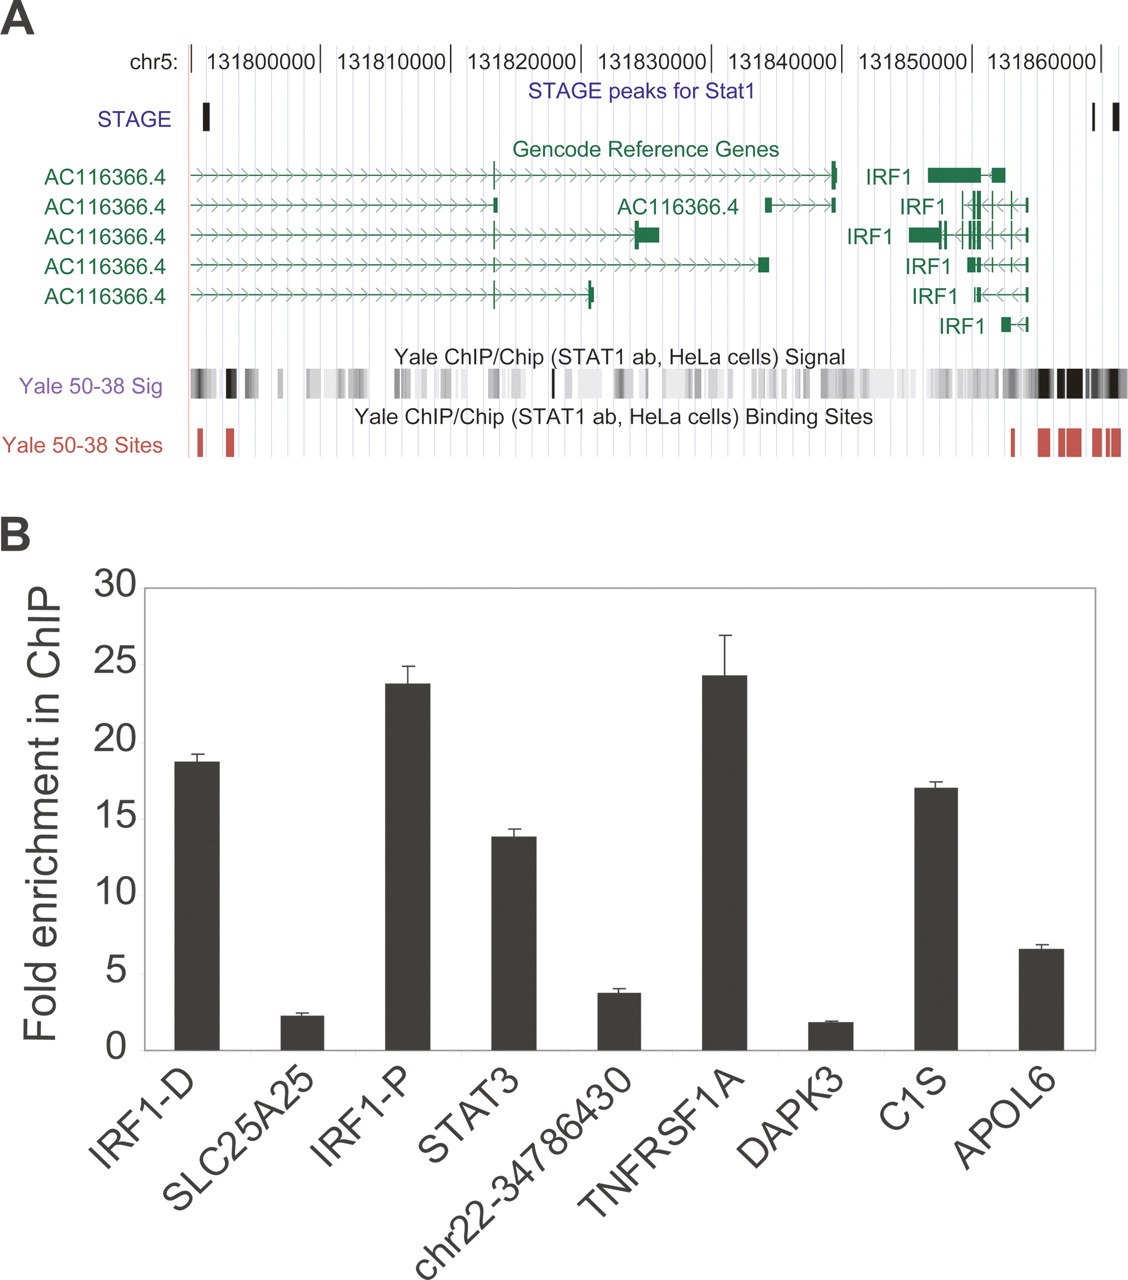
(A) STAT1 binding sites in the ENCODE regions. A portion of the ENCODE region ENm002 is shown as displayed in the UCSC Human Genome Browser. Three out of the seven STAT1 binding sites identified by STAGE matched STAT1 binding sites identified by ChIP-chip analysis performed on NimbleGen ENCODE region tiling arrays. Transcripts identified in this region by the GENCODE project are shown in green. The bottom shows raw ratio data as well as peak calls for STAT1 binding sites from NimbleGen ChIP-chip data. (B) Quantitative ChIP analysis of binding sites identified by STAGE. Nine out of 10 binding sites detected by STAGE were validated as true binding loci by quantitative PCR. Columns show fold enrichment of each locus in the ChIP sample relative to input DNA, normalized to an unrelated control locus. STAGE detected two binding sites separated by >1500 bp in the IRF1 promoter which are indicated in the figure. IRF-D indicates the distal (IRF1-distal) and IRF1-P indicates the proximal site (IRF1-proximal). No genes were found in the proximity of the site indicated as chr22-34786430.


