
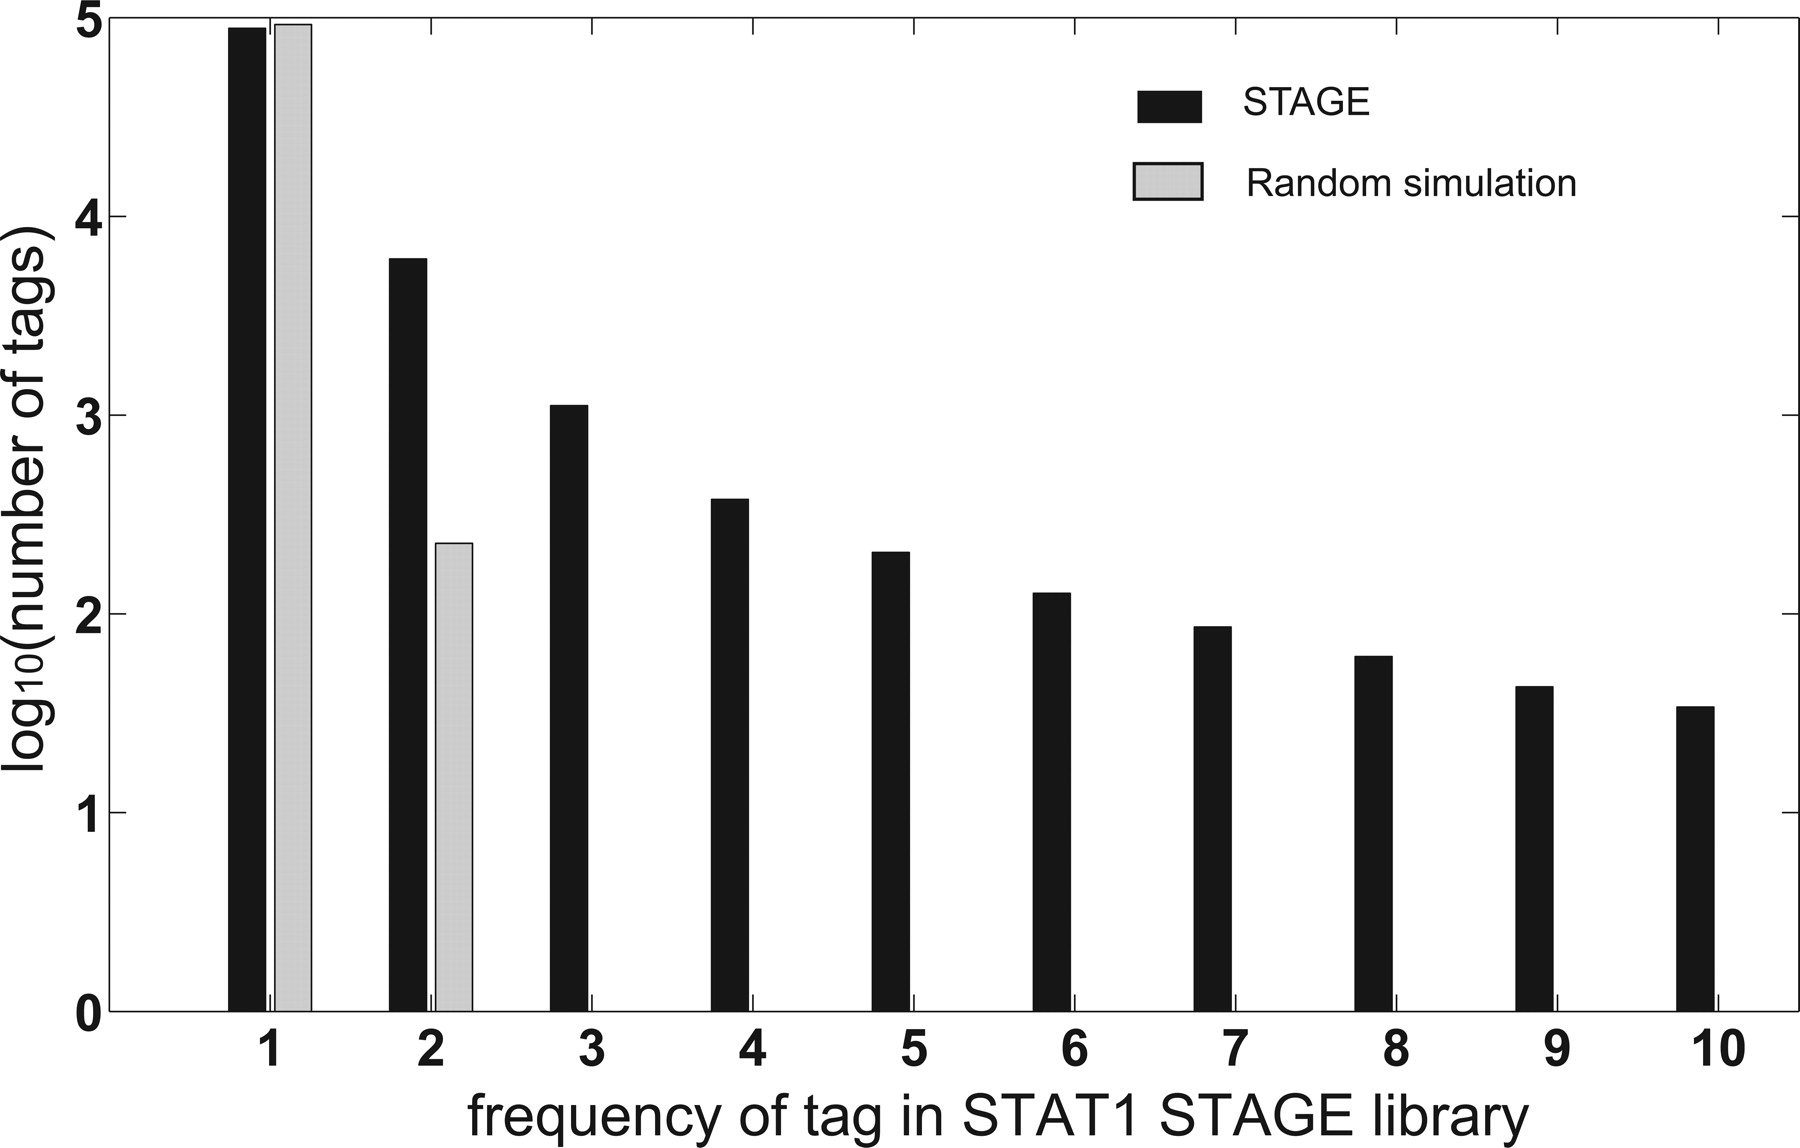
Comparison of the STAT1 STAGE tag library with a simulated randomly generated background library. A background library was generated to simulate STAGE tag libraries by randomly selecting the same number of tags from the genome as the experimental STAGE library. This procedure was repeated 20 times and the values were averaged. Only tags with a single, unique hit on the genome were used in this analysis. The numbers of single-hit tags (Y-axis) were plotted against the frequencies of those tags in the random (gray bars) and experimental (black bars) tag library (X-axis). For frequencies of 2 and above, the STAGE tag library for STAT1 shows a clear enrichment over a randomly generated tag library.


