
Table 4.
Monte Carlo simulation of the expected number of PET clusters from the ENCODE regions as a function of the PET cluster size
Click on table to view larger version.
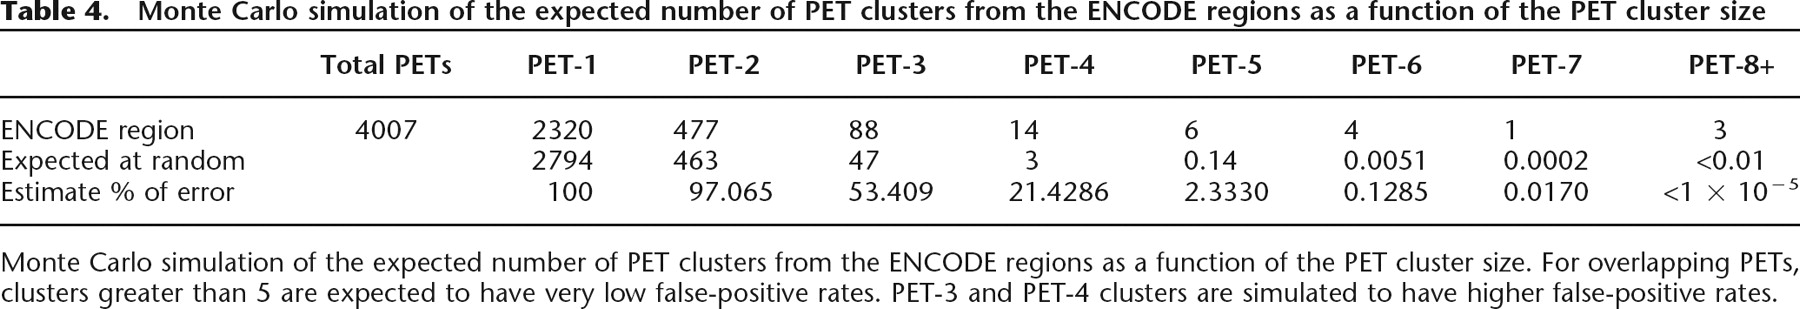
Monte Carlo simulation of the expected number of PET clusters from the ENCODE regions as a function of the PET cluster size. For overlapping PETs, clusters greater than 5 are expected to have very low false-positive rates. PET-3 and PET-4 clusters are simulated to have higher false-positive rates.


