
Comparison of ranked target lists for paired samples hybridized either in the presence or absence of Cot-1 DNA on the 50 b every 38-b array platform
Click on table to view larger version.
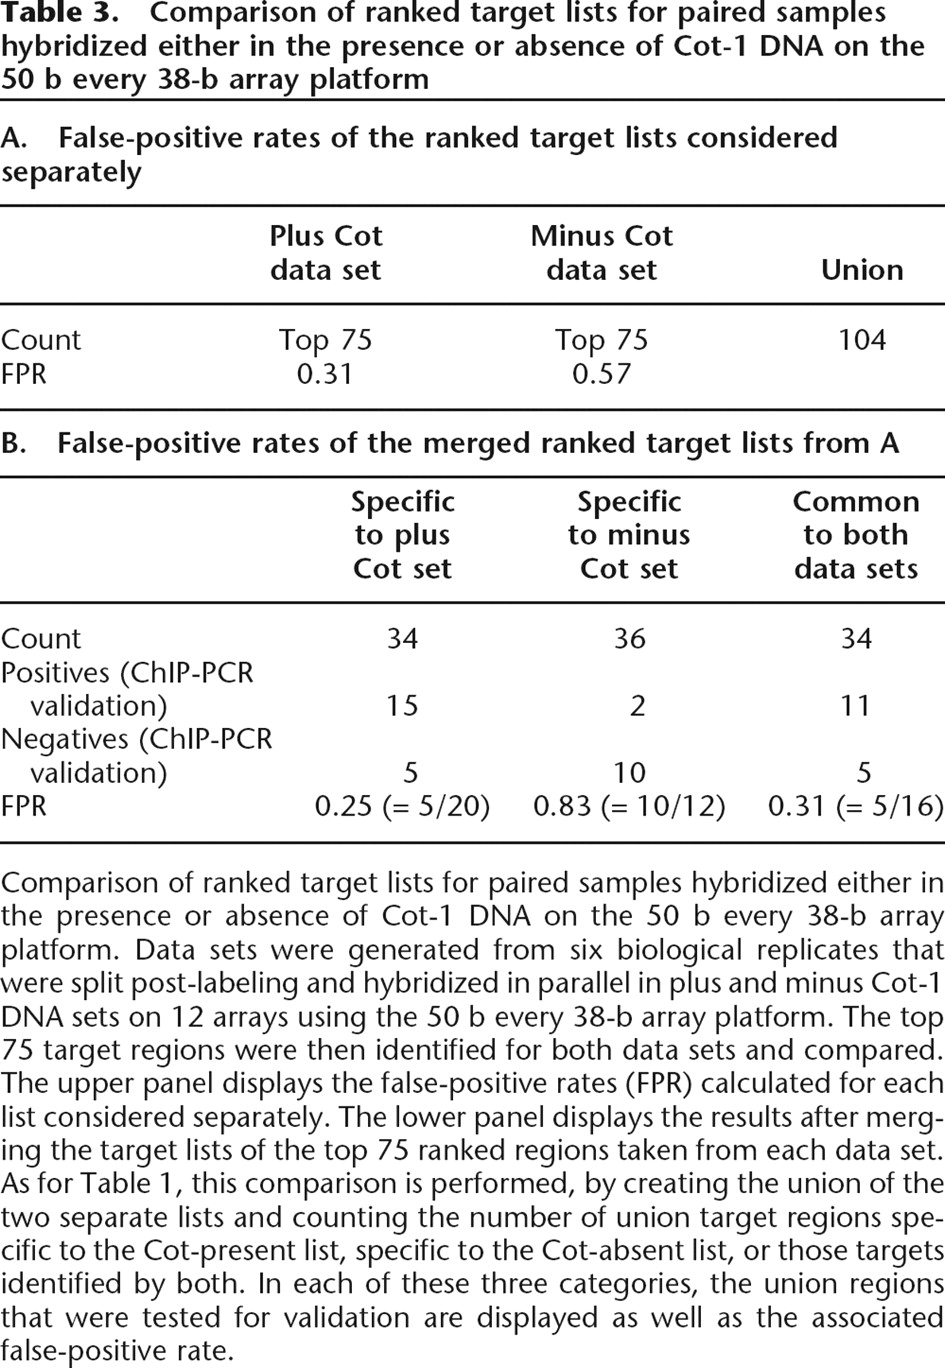
Comparison of ranked target lists for paired samples hybridized either in the presence or absence of Cot-1 DNA on the 50 b every 38-b array platform. Data sets were generated from six biological replicates that were split post-labeling and hybridized in parallel in plus and minus Cot-1 DNA sets on 12 arrays using the 50 b every 38-b array platform. The top 75 target regions were then identified for both data sets and compared. The upper panel displays the false-positive rates (FPR) calculated for each list considered separately. The lower panel displays the results after merging the target lists of the top 75 ranked regions taken from each data set. As for Table 1, this comparison is performed, by creating the union of the two separate lists and counting the number of union target regions specific to the Cot-present list, specific to the Cot-absent list, or those targets identified by both. In each of these three categories, the union regions that were tested for validation are displayed as well as the associated false-positive rate.


