
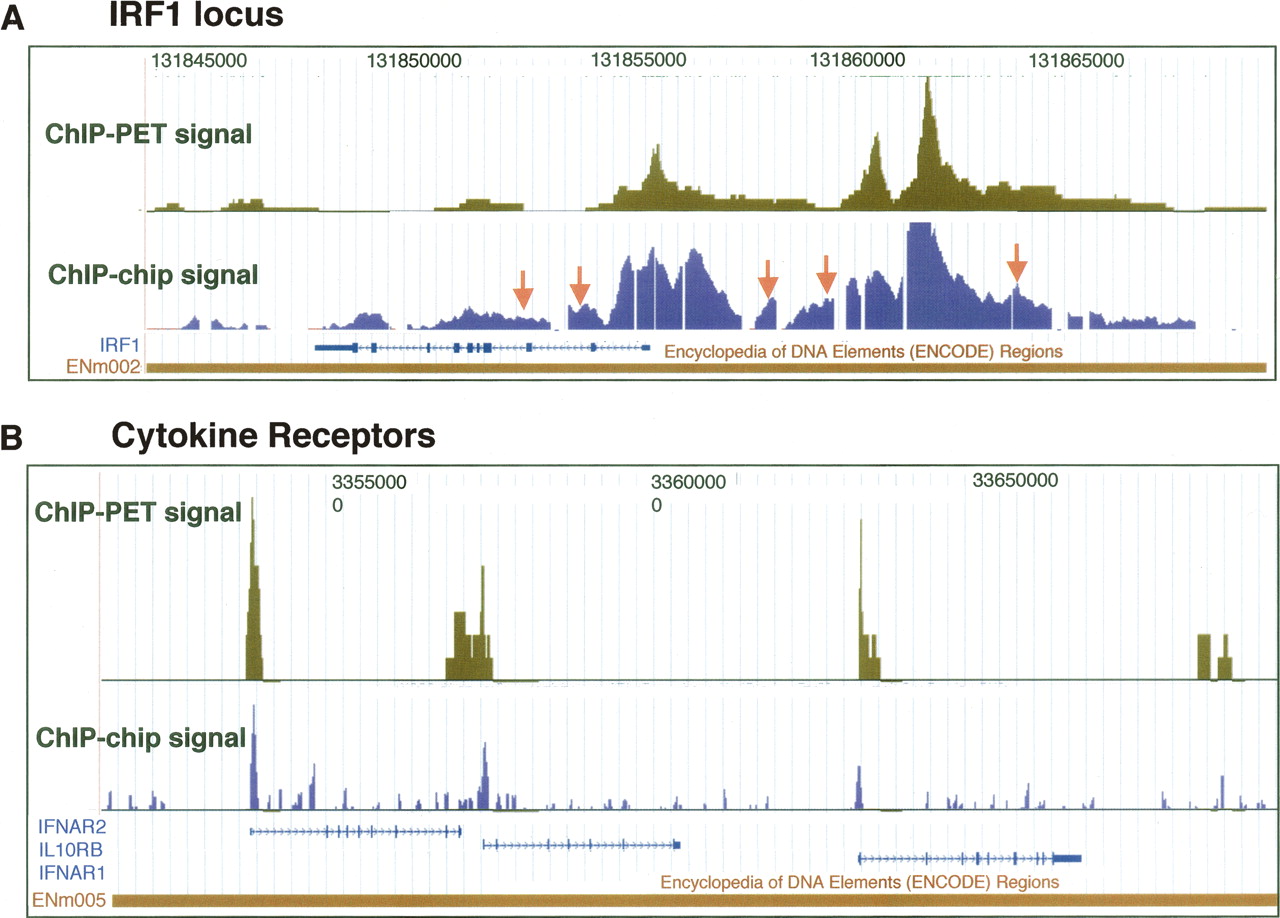
Comparison of ChIP-chip and ChIP-PET. Signal tracks for the ChIP-chip data set from the 50 b every 50-b platform are shown and compared to ChIP-PET signals (the vertical axis corresponds to the number of overlapping ditags at a given genomic coordinate). (A) The IRF1 locus on Chromosome 5 (coordinates 131,842,000 to 131,865,000 from build NCBIv35 [hg17]). The orange arrows indicate the validated ChIP-chip targets from the 50-b array experiment that were on the shoulders of ChIP-PET clusters in the IRF1 region. (B) The region on Chromosome 21 (coordinates 33,500,000 to 33,700,000) containing the cytokine receptors IFNAR2, IL10RB, and IFNAR1. Significant concurrence is observed between the signal readouts from each method.


