
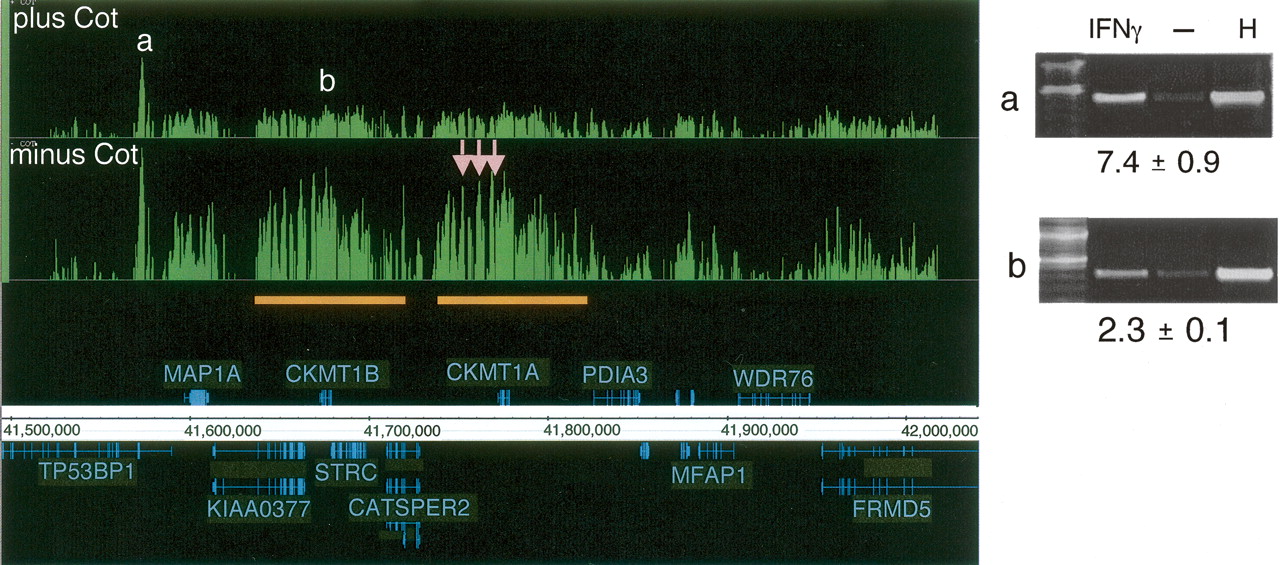
The effect of Cot-1 DNA in determining STAT1 targets. Signal enrichment tracks are shown for data sets of paired samples (see Methods; Supplemental Table 1) that were hybridized either in the presence of Cot-1 DNA (top track) and or in the absence of Cot-1 DNA (lower track), both on the 50 b every 38-b array platform. Annotations above the coordinate axis are for genes on the forward strand, and annotations below the coordinate axis are for genes on the reverse strand. Signal enrichment tracks are plotted to the same scale from 0 to 3.3 for the Cot-present and Cot-absent data sets. Targets with labels “a” and “b” are identified by both experiments (ChIP-PCR gel images are shown). Three targets (pink arrows) appeared only in the Cot-absent experiment and were identified as false positives by ChIP-PCR validation (gel images not shown). The orange bars indicate a region of segmental duplication, which is a potential cause of the false positives (due to cross-hybridization with confirmed target “b”). For the ChIP-PCR validations displayed, the lanes are labeled for ChIP DNA from IFNG-stimulated cells, ChIP DNA from unstimulated cells, and for HeLa S3 genomic DNA. The fold enrichments are indicated and were calculated for several biological replicates (see Methods).


