
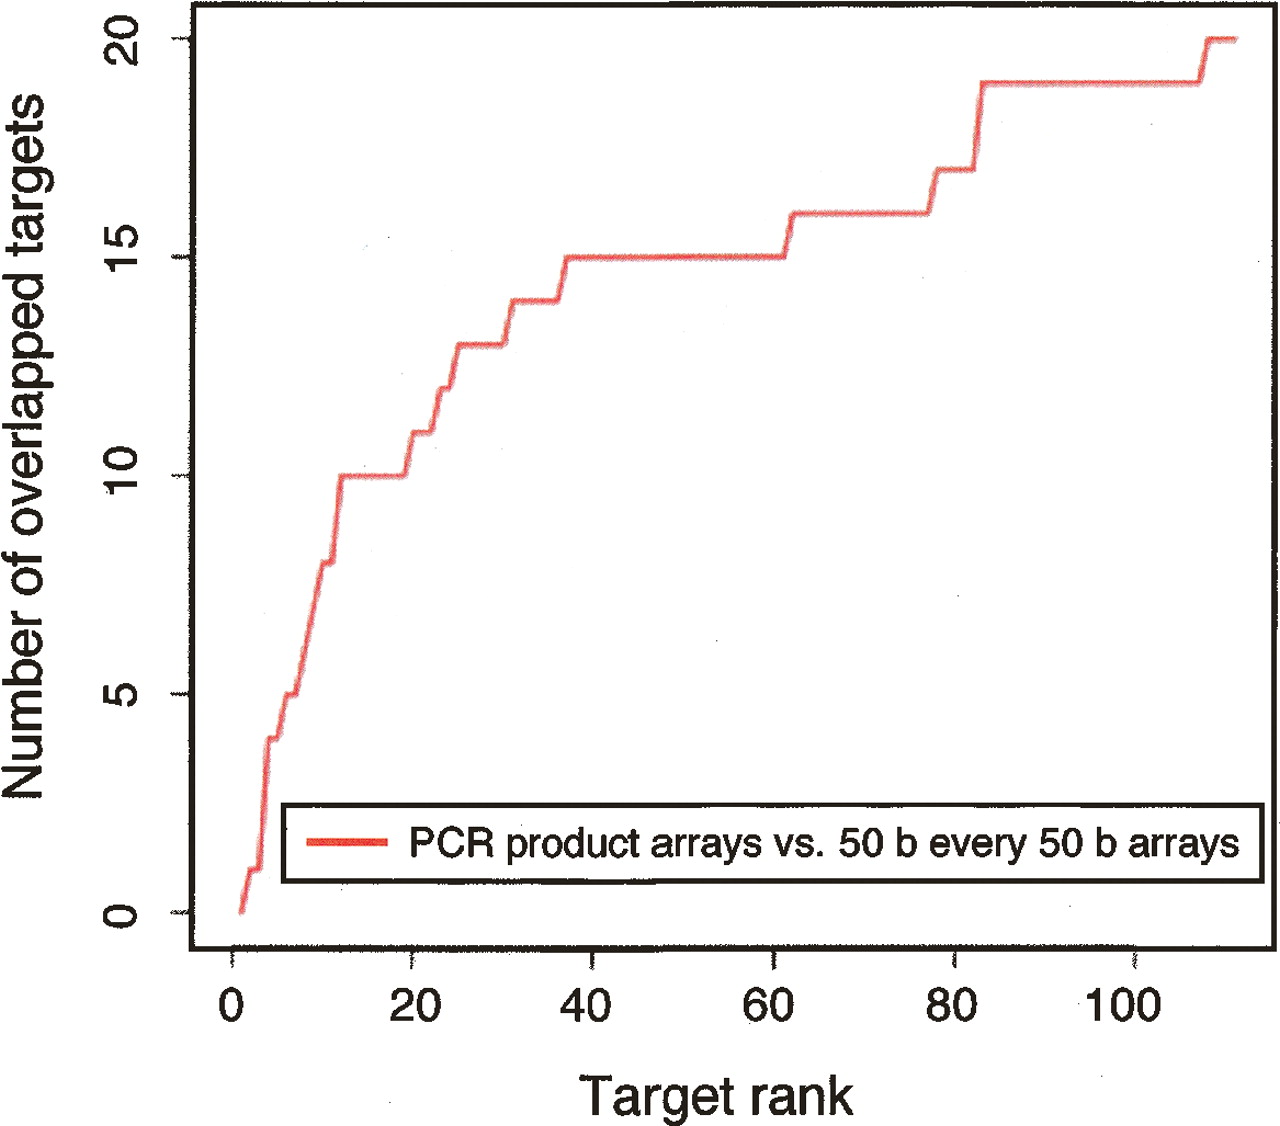
Figure 4.
Agreement between the ranked target lists for the 50 b every 50-b array and the PCR product array platforms. Each data set is comprised of multiple biological replicates with one replicate hybridized per array (Supplemental Table 1). The vertical axis is the number of targets common between the two rank lists up to a certain rank (the horizontal axis). The agreement increases steeply for the highest-ranked targets and then starts to plateau.


