
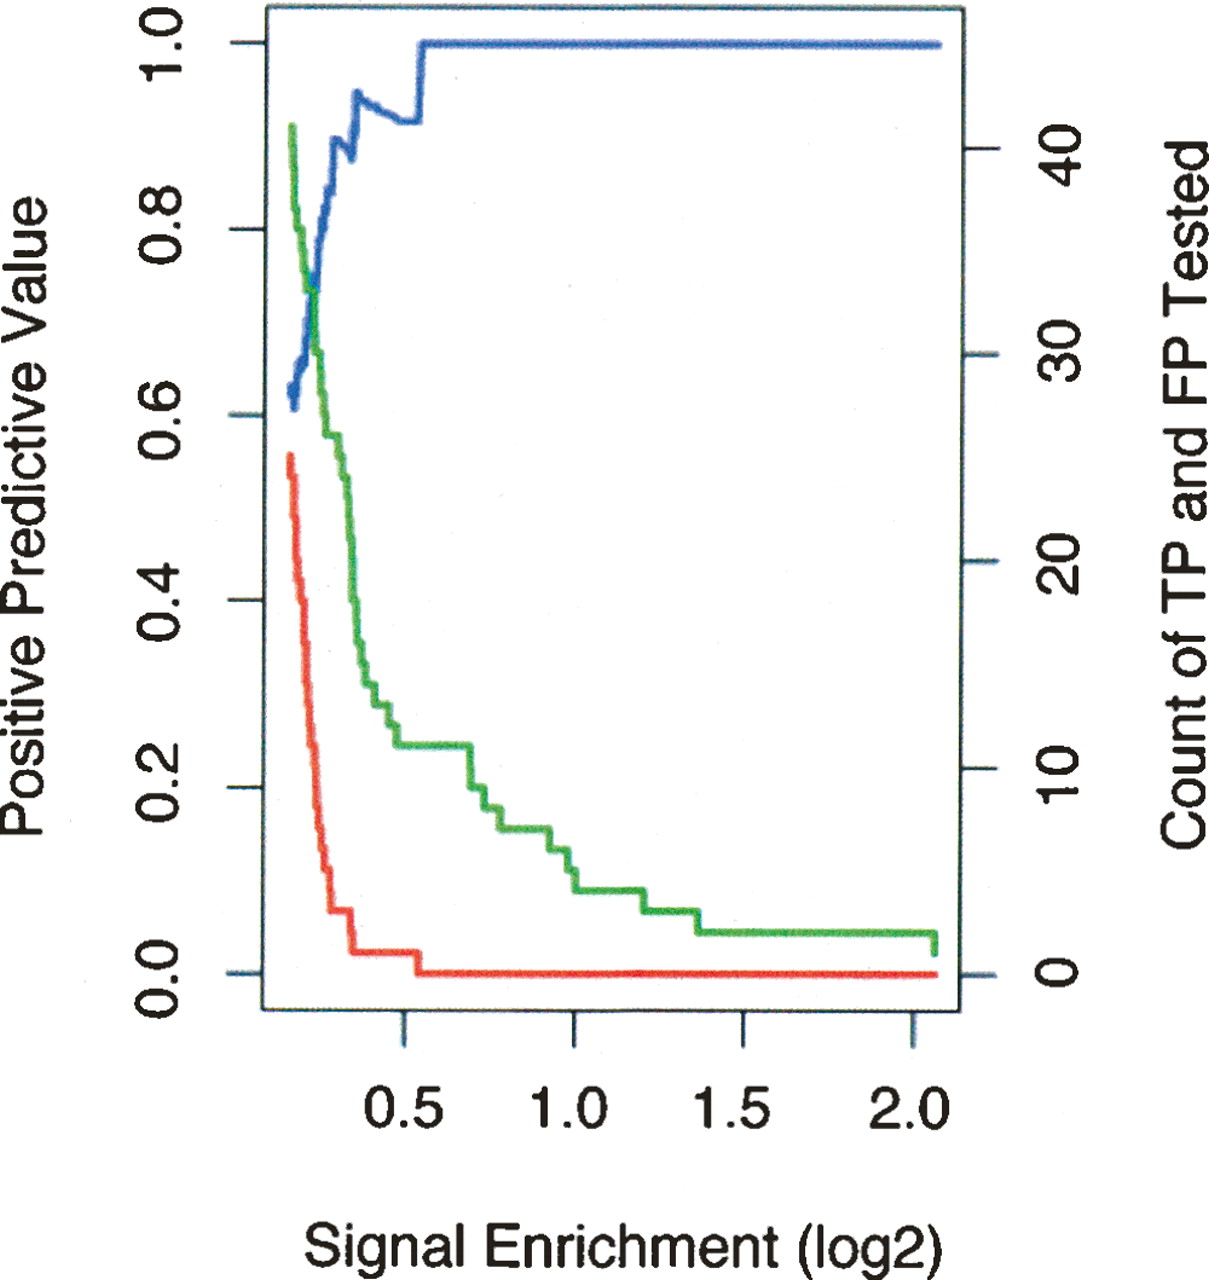
Validation frequency as a function of signal for the 50 b every 50-b array data set. The data from Figure 2A were analyzed as a function of array signal enrichment for the 50 b every 50-b array platform. Signal enrichment is defined as the log2 ratio of signal intensity of the ChIP DNA over the signal intensity of the reference DNA sample (for STAT1, this is the log2 ratio of intensities for IFNG-stimulated against unstimulated ChIP DNA samples). A target region is identified as a “peak” in a signal enrichment track (see Fig. 1; for details, see Supplemental Methods) and is assigned its maximal signal enrichment, the height of the peak. The number of true positives is the green line, the number of false positives is the red line, and the positive predictive value is the blue line as in Figure 2A. The horizontal scale in this figure is in the opposite orientation to the horizontal scale displayed in Figure 2; high signal enrichment, which appears to the right-hand side here, corresponds to higher rank, which is to the left in Figure 2. At a log2 signal of ∼0.25, the number of false positives increases sharply to the left.


