
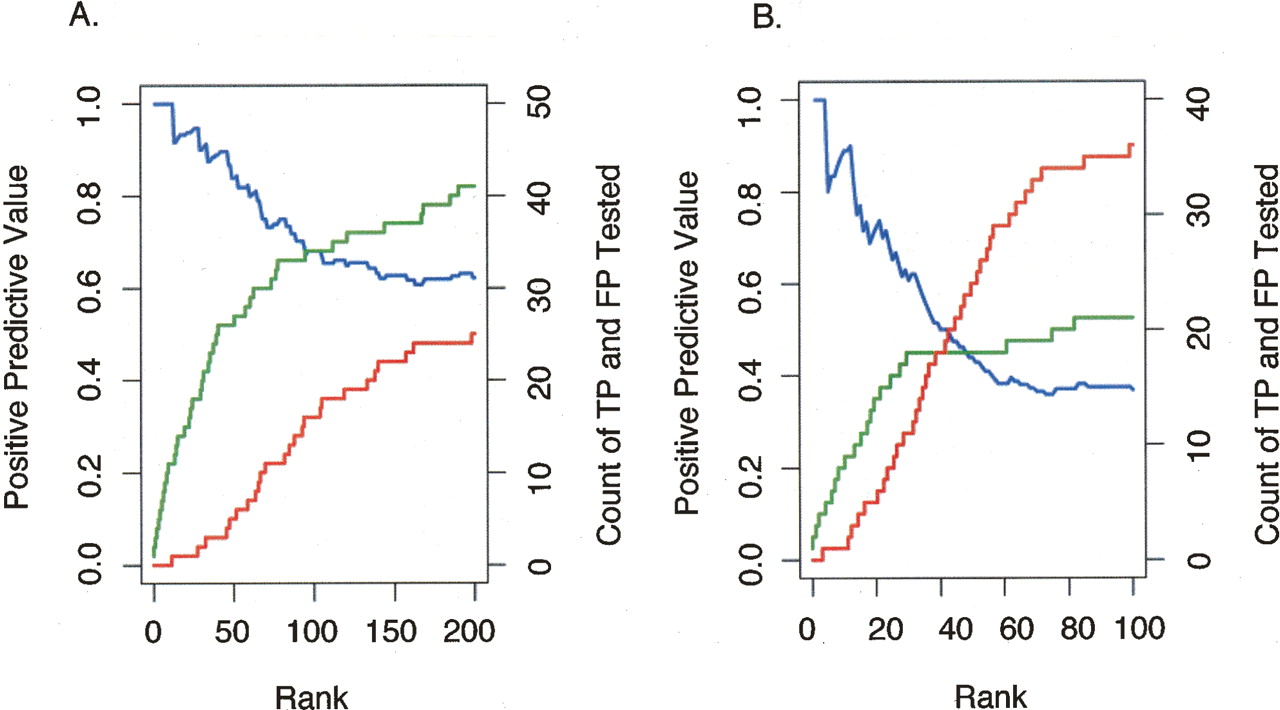
Validation frequency as a function of rank order for the 50 b every 50-b array and PCR product array platforms. For each ChIP-chip data set (derived from multiple biological replicates with one replicate hybridized per array) (Supplemental Table 1), we identified the target regions above a threshold. The targets were tested and divided into true positives (TP) and false positives (FP) based on a ChIP-PCR validation assay (as described in Methods). Sensitivity [defined as TP/(TP + FN), where FN are the number of false negatives] and specificity [defined as TN/(TN + FP), where TN are the number of true negatives] of the target list at this threshold are difficult to accurately estimate since the total number of actual binding sites (TP + FN) as well as the number of true negatives (TN) are not known, and other methods for direct, in vivo identification binding independent of ChIP methods do not exist. Nonetheless, the positive predictive value [defined as TP/(TP + FP)] for ChIP-chip experiments can be estimated using data from ChIP-PCR validations. (A) The number of targets confirmed by validation, true positives (green line), as well as the number targets that did not validate, false positives (red line), is plotted as a function of target rank (ordered by signal enrichment) for the 50 b every 50-b array platform (from three biological replicate arrays). The positive predictive value (blue line) is also shown as a function of rank. (B) The number of true positives (green line), the number of false positives (red line), and the positive predictive value (blue line) are shown as a function of rank for the PCR product array platform (data from six biological replicate arrays).


