
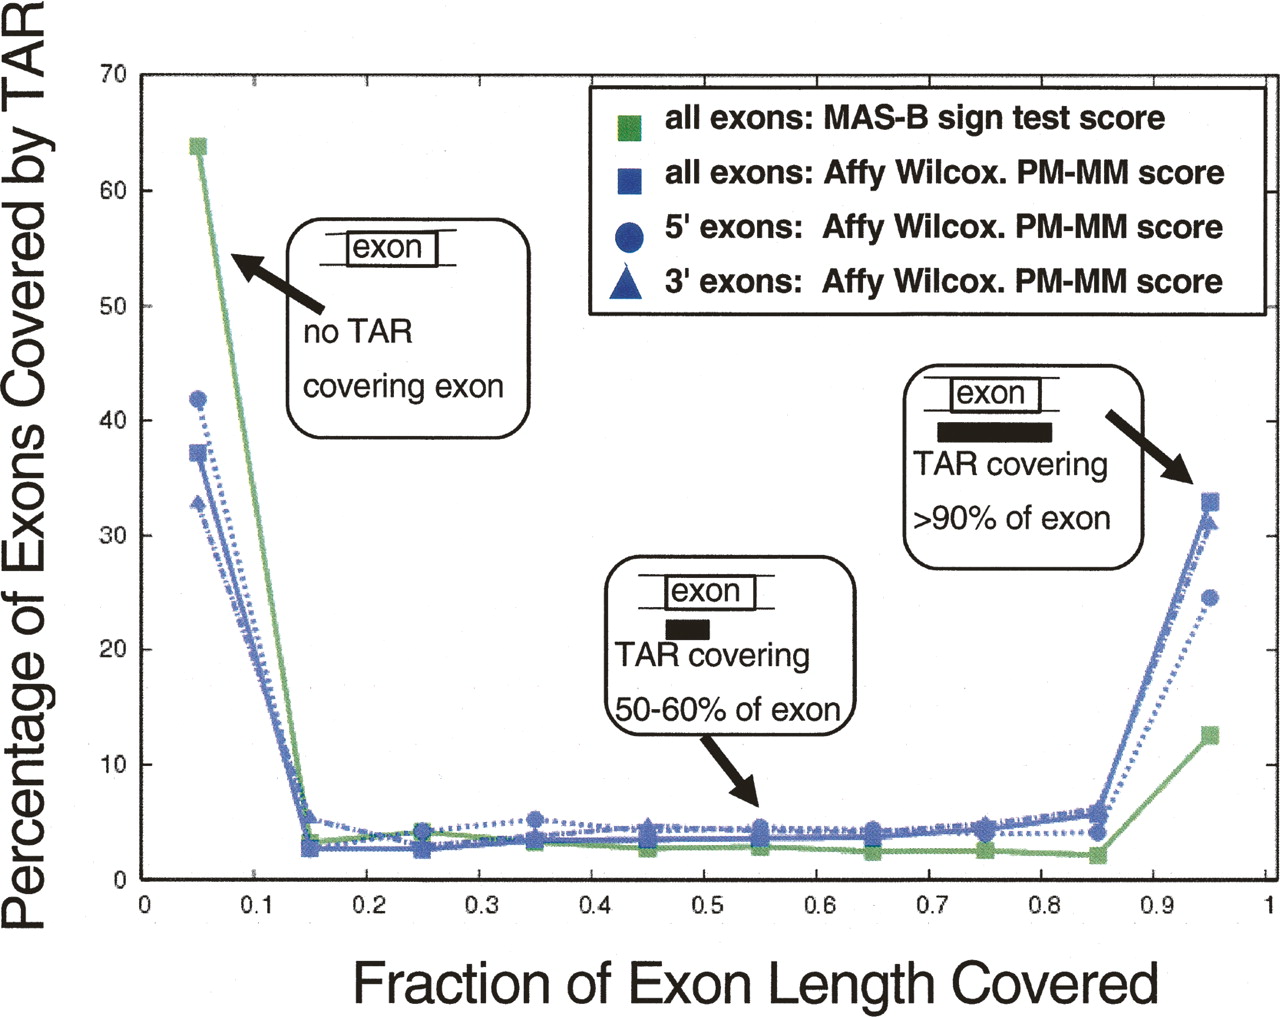
Figure 4.
Distribution of GENCODE exon coverage by placenta TARs: all exons (MAS-B, green squares, and Affy, blue squares); 5′ exons (Affy, blue circles); 3′ exons (Affy, blue triangles). (x-axis) The fraction to which an exon is covered by a TAR; 0.0–1.0 split up in 10 bins. (y-axis) The percentage of exons covered by a TAR to the fraction represented on the x-axis.


