
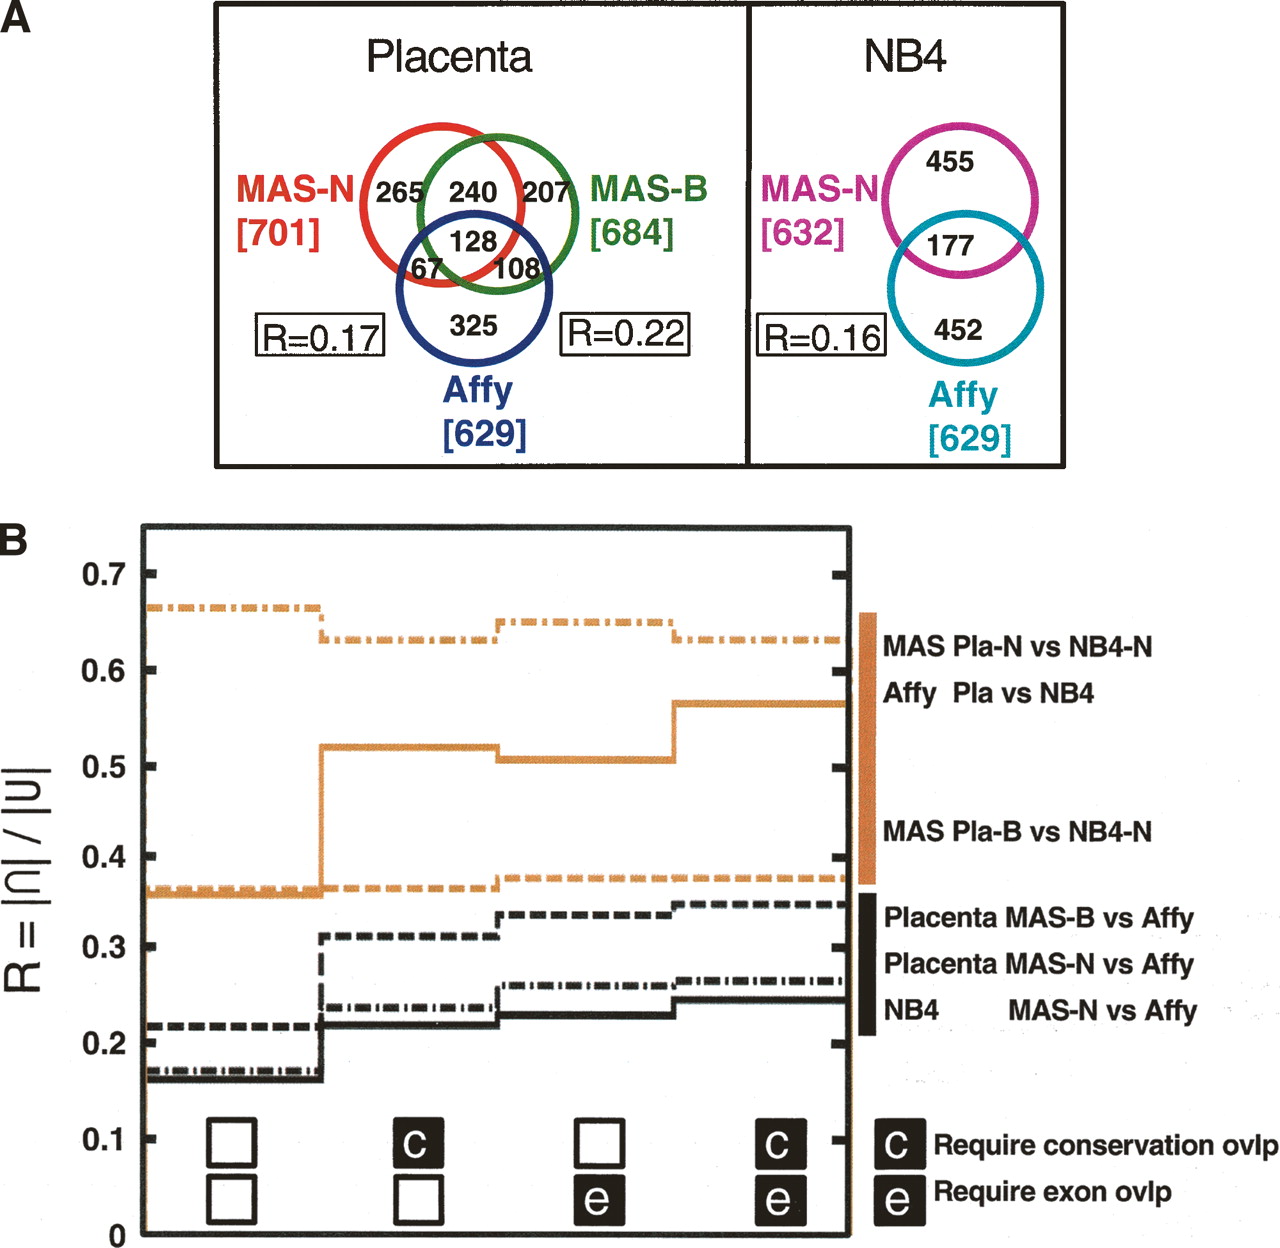
TAR set agreement. (A) Overlap of TAR sets, measured in number of overlapping nucleotides (kilobases). All three placenta TAR sets (MAS-B, MAS-N, Affy) and both NB4 TAR sets (MAS-N and Affy). R is a measure of the size of the overlap. R = |∩|/|U| (calculated pairwise for the three placenta TAR sets). (B) Size of TAR set overlap, expressed in R, for comparisons within biological samples but across different array platforms (black lines), and comparisons within array platforms but across the biological samples (brown lines). Values in the leftmost column of the graph are calculated with no further constraints. Second column, only TARs overlapping with conserved regions are included. Third column, only TARs overlapping with GENCODE exons are included. Fourth column, only TARs overlapping with both conserved and exon regions are included.


