
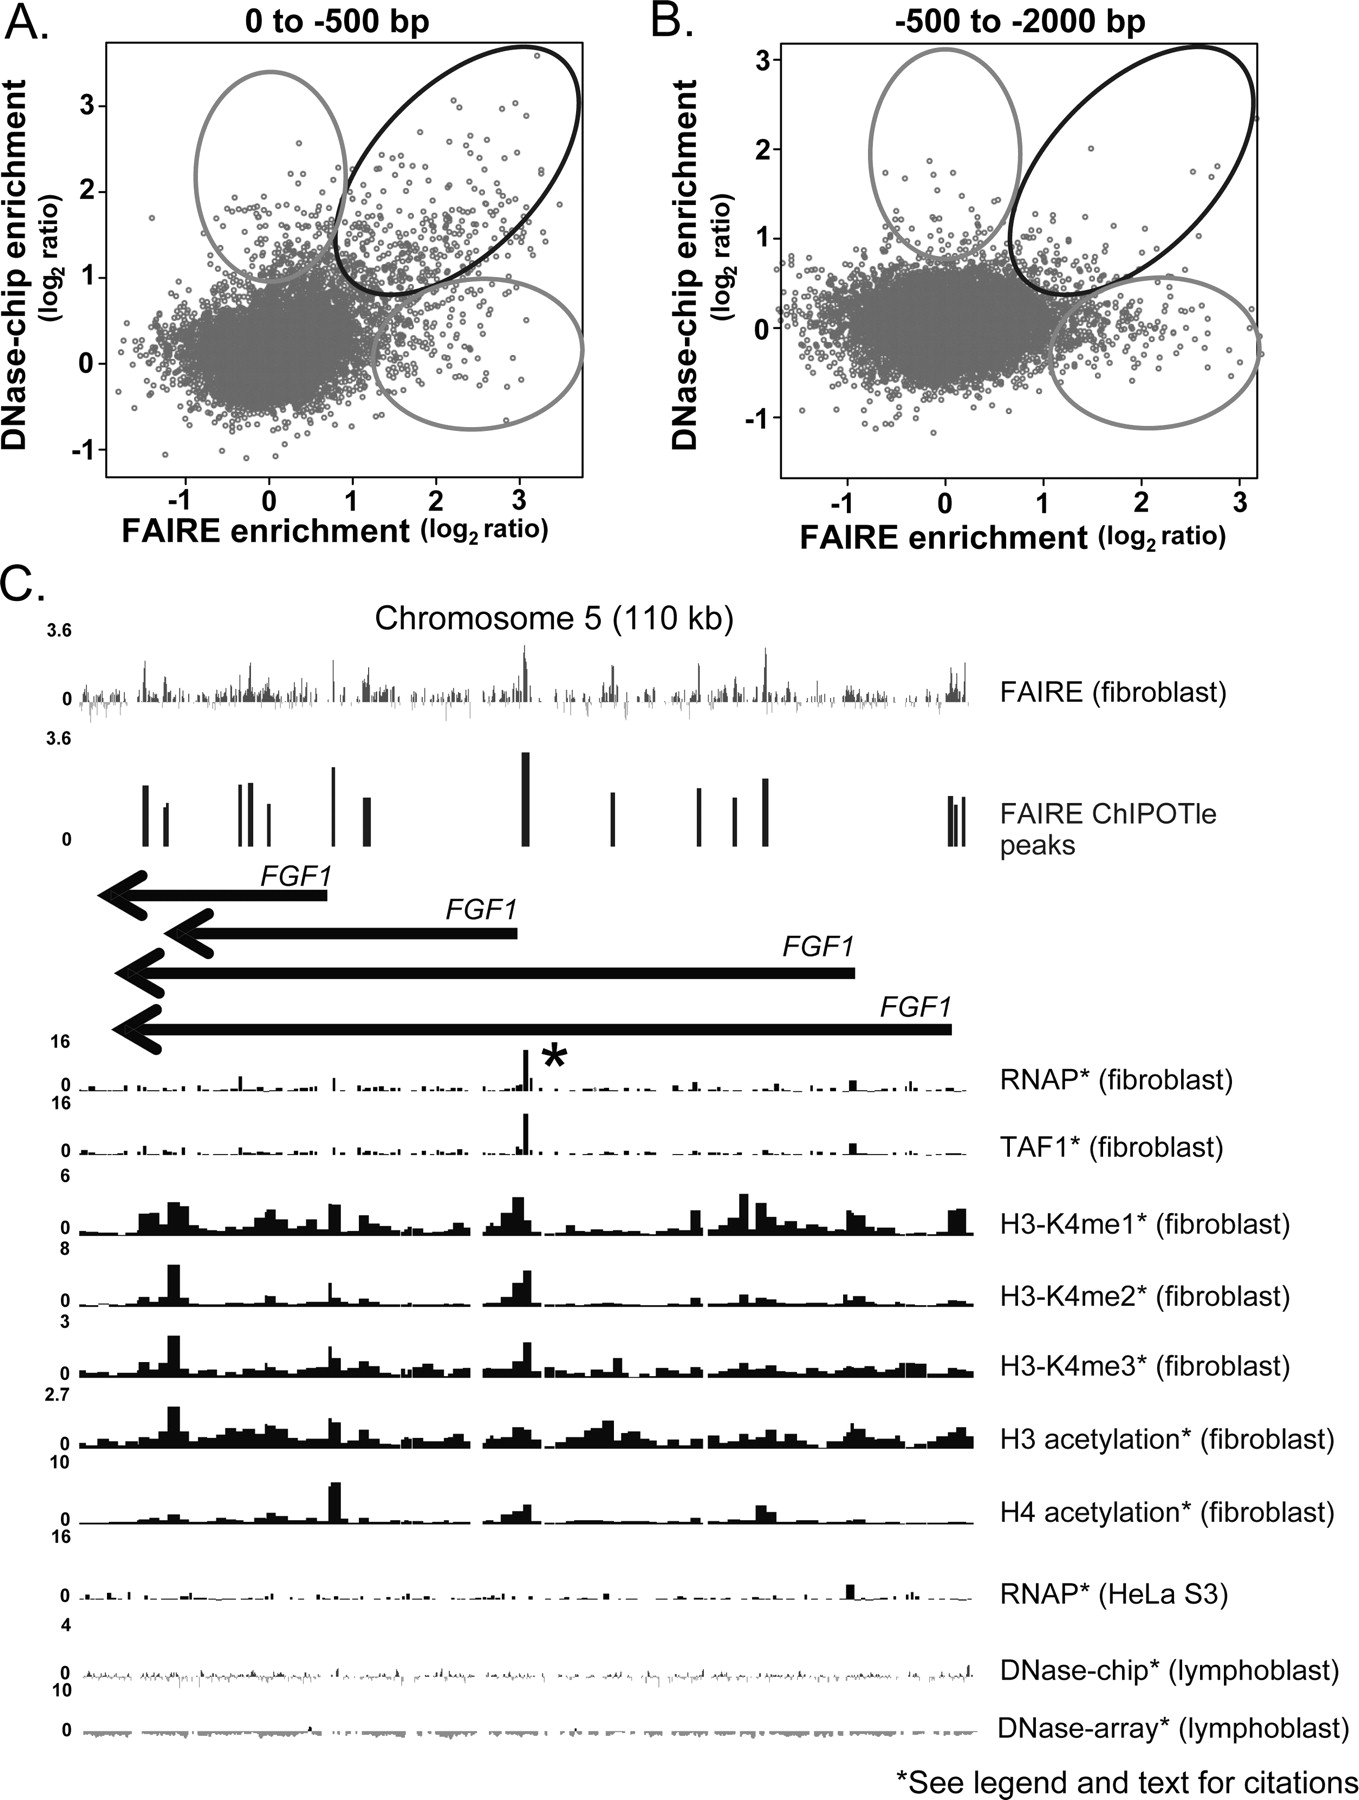
Cell-type specific differences identified by FAIRE. (A) A scatterplot of the log2 values for individual 50-mer probes from the DNase-chip (Crawford et al. 2006) and FAIRE data sets that mapped between 0 and 500 bp upstream of a GENCODE TSS (Harrow et al. 2006) are plotted. The black oval indicates probes that had high enrichment values in both data sets, whereas the gray ovals indicate probes with enrichment values that were high in only one of the data sets. (B) Same as A, but probes that mapped from 500 to 2000 bp upstream of a GENCODE TSS are plotted. (C) The fibroblast growth factor 1 (FGF1) gene, which has several annotated TSSs, exhibits extensive FAIRE signal (performed in fibroblast cells) but no detectable DNaseI signal (performed in lymphoblastoid cells). The asterisk indicates the presence of RNAP and TAF1 ChIP signal over this region in lung fibroblast (IMR90) cells (Kim et al. 2005a, b). The units of data for each track are described in Figure 2. The region shown corresponds to chromosome 5 coordinates 141,950,000 to 142,060,000.


