
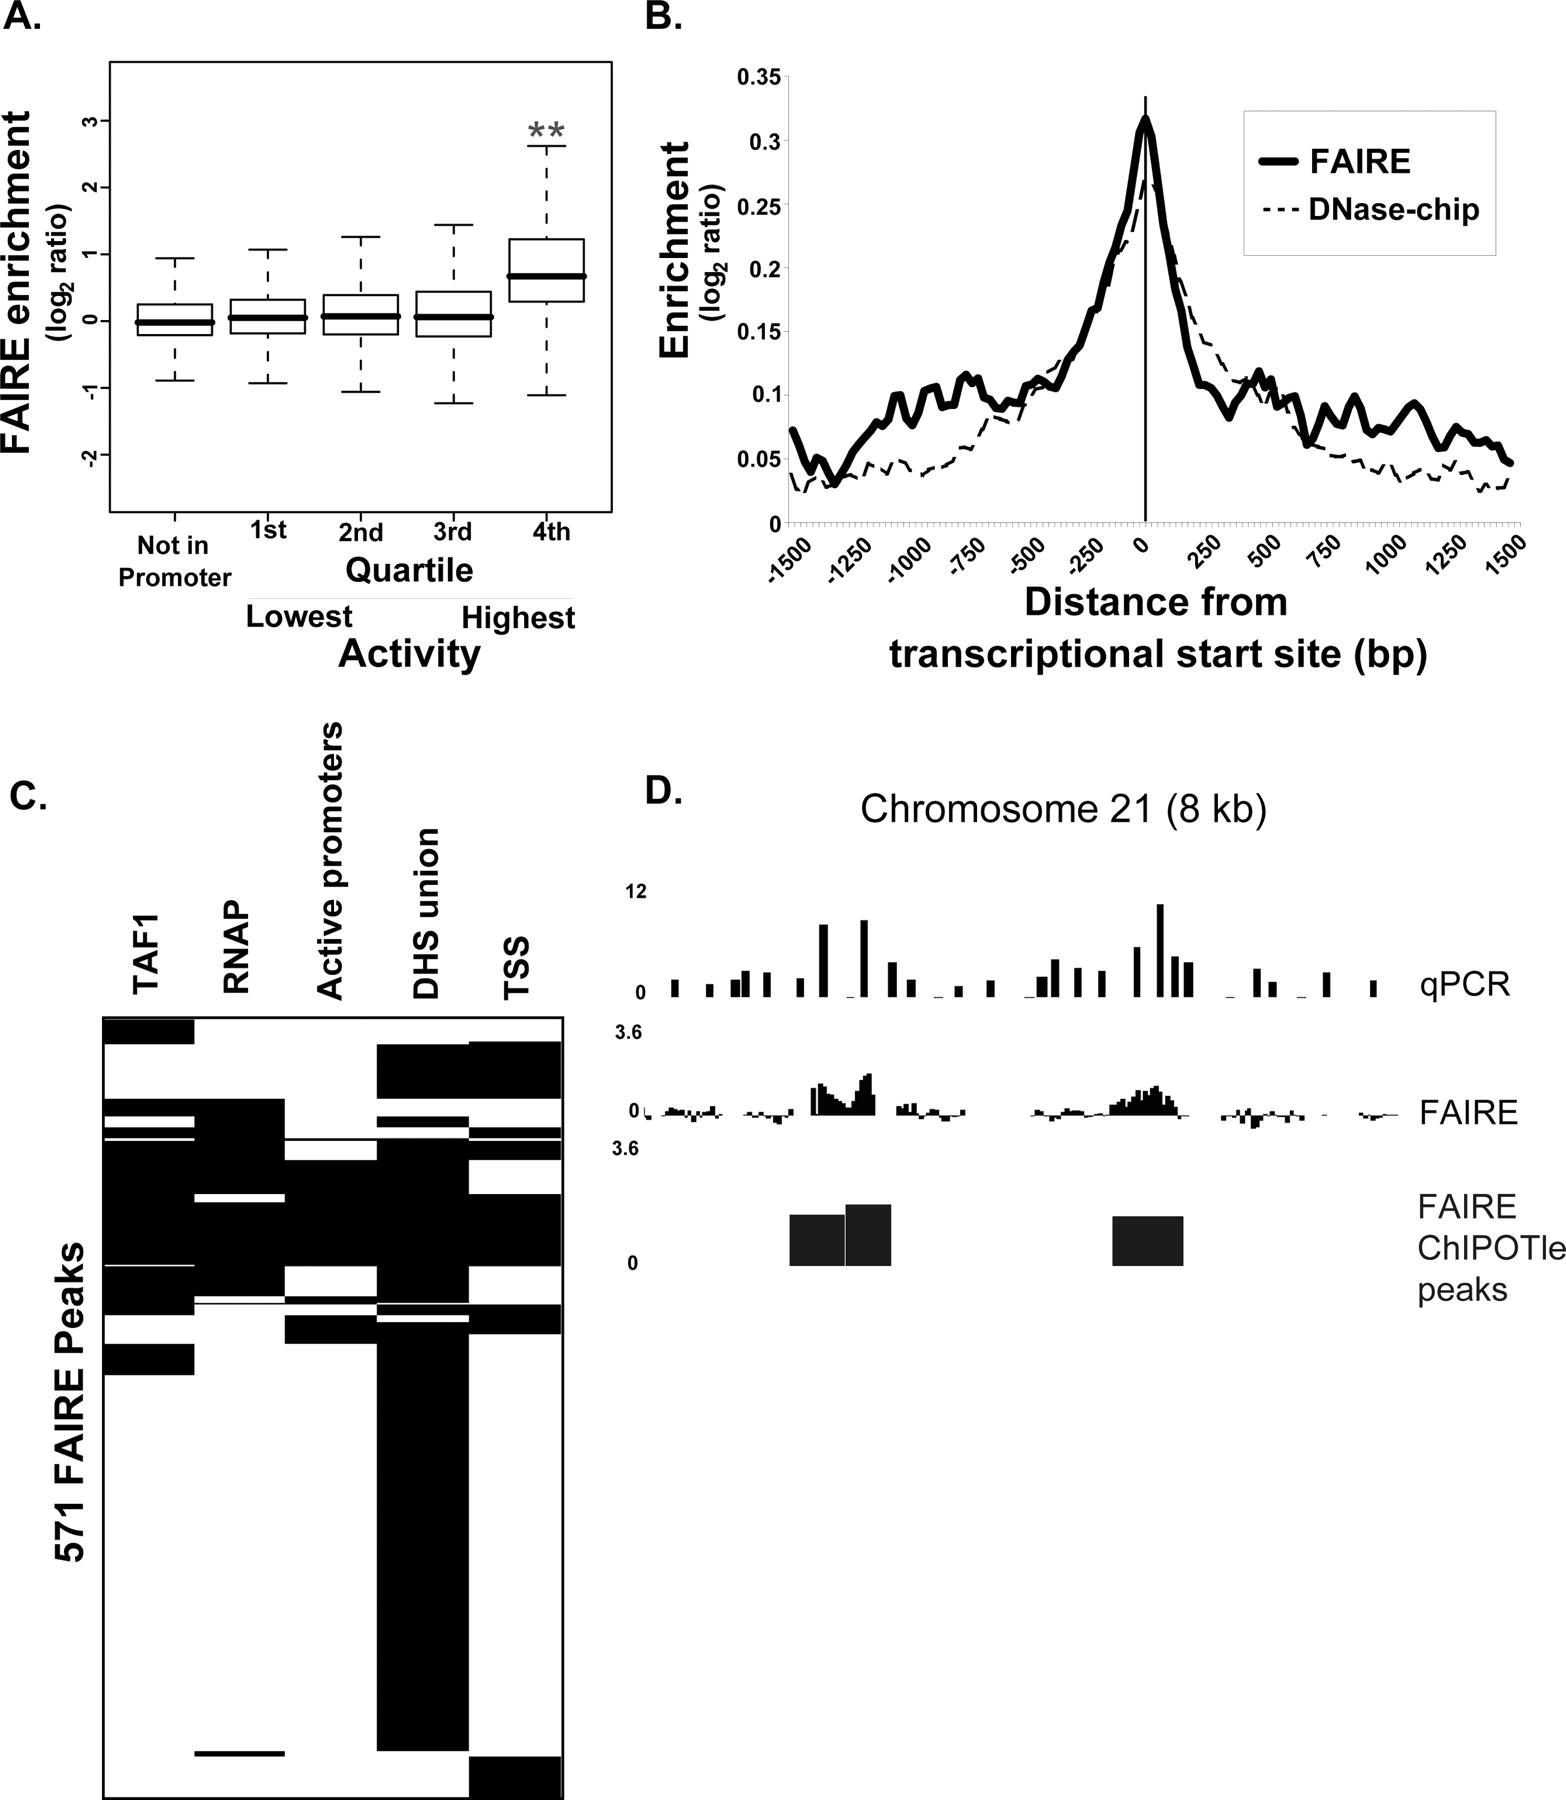
FAIRE isolates DNA at the TSSs of genes. (A) Probes that mapped to predicted promoters were divided into quartiles based on the level of activity for each promoter, which was measured by using it to drive a reporter construct (Trinklein et al. 2003; Cooper et al. 2006). The reported activity represents an average from the 16 different cell types assayed. Boxes represent the 25th to the 75th percentile of the FAIRE data (interquartile range, IQR), the black line in the middle of the box is the median, and the dotted lines extend out 1.5 times the IQR. Probes within the regions of highest regulatory activity (fourth quartile, right side), represent the most active promoters and correspond to regions most efficiently isolated by FAIRE (**P < 10−100). (B) Probes from the high-density oligonucleotide tiling array were mapped relative to GENCODE annotated TSSs (Ashurst et al. 2005; Harrow et al. 2006). A sliding window (50 bp, 1-bp steps) was then used to calculate the average FAIRE enrichment from 1.5 kb upstream to 1.5 kb downstream of the TSS (solid line). For comparison, the same analysis was performed using the DNase-chip data set (broken line); DNase-chip samples were hybridized to the same design of high-density oligonucleotide tiling array as was used for FAIRE. (C) A representation of the relationship between FAIRE peaks and other annotated features. Each row corresponds to one of the 571 FAIRE peaks that overlap with at least one of the following: a TSS (Ashurst et al. 2005; Harrow et al. 2006); union of DHS (Crawford et al. 2006; Sabo et al. 2006); 75th percentile of promoter activity (Trinklein et al. 2003; Cooper et al. 2006); RNAP ChIP–chip; or TAF1 ChIP–chip (Kim et al. 2005a, b). A black bar represents overlap with the FAIRE signal, whereas white represents no overlap (“overlap” defined in Table 1 legend). Not shown are the 437 FAIRE peaks that do not overlap with any of these marks. Data were clustered for display (Eisen et al. 1998). (D) qPCR validation of the microarray data was performed over three 8-kb regions. The height of the bars from the qPCR analysis represents the enrichment of the FAIRE samples relative to the uncrosslinked reference; the FAIRE data and peaks are the same as described in Figure 2. A representative region corresponding to chromosome 21 coordinates 32,813,792–32,820,968 is shown. Note that this region contains no annotated genes and that these were “orphan” FAIRE peaks, unassigned to any other active chromatin mark.


