
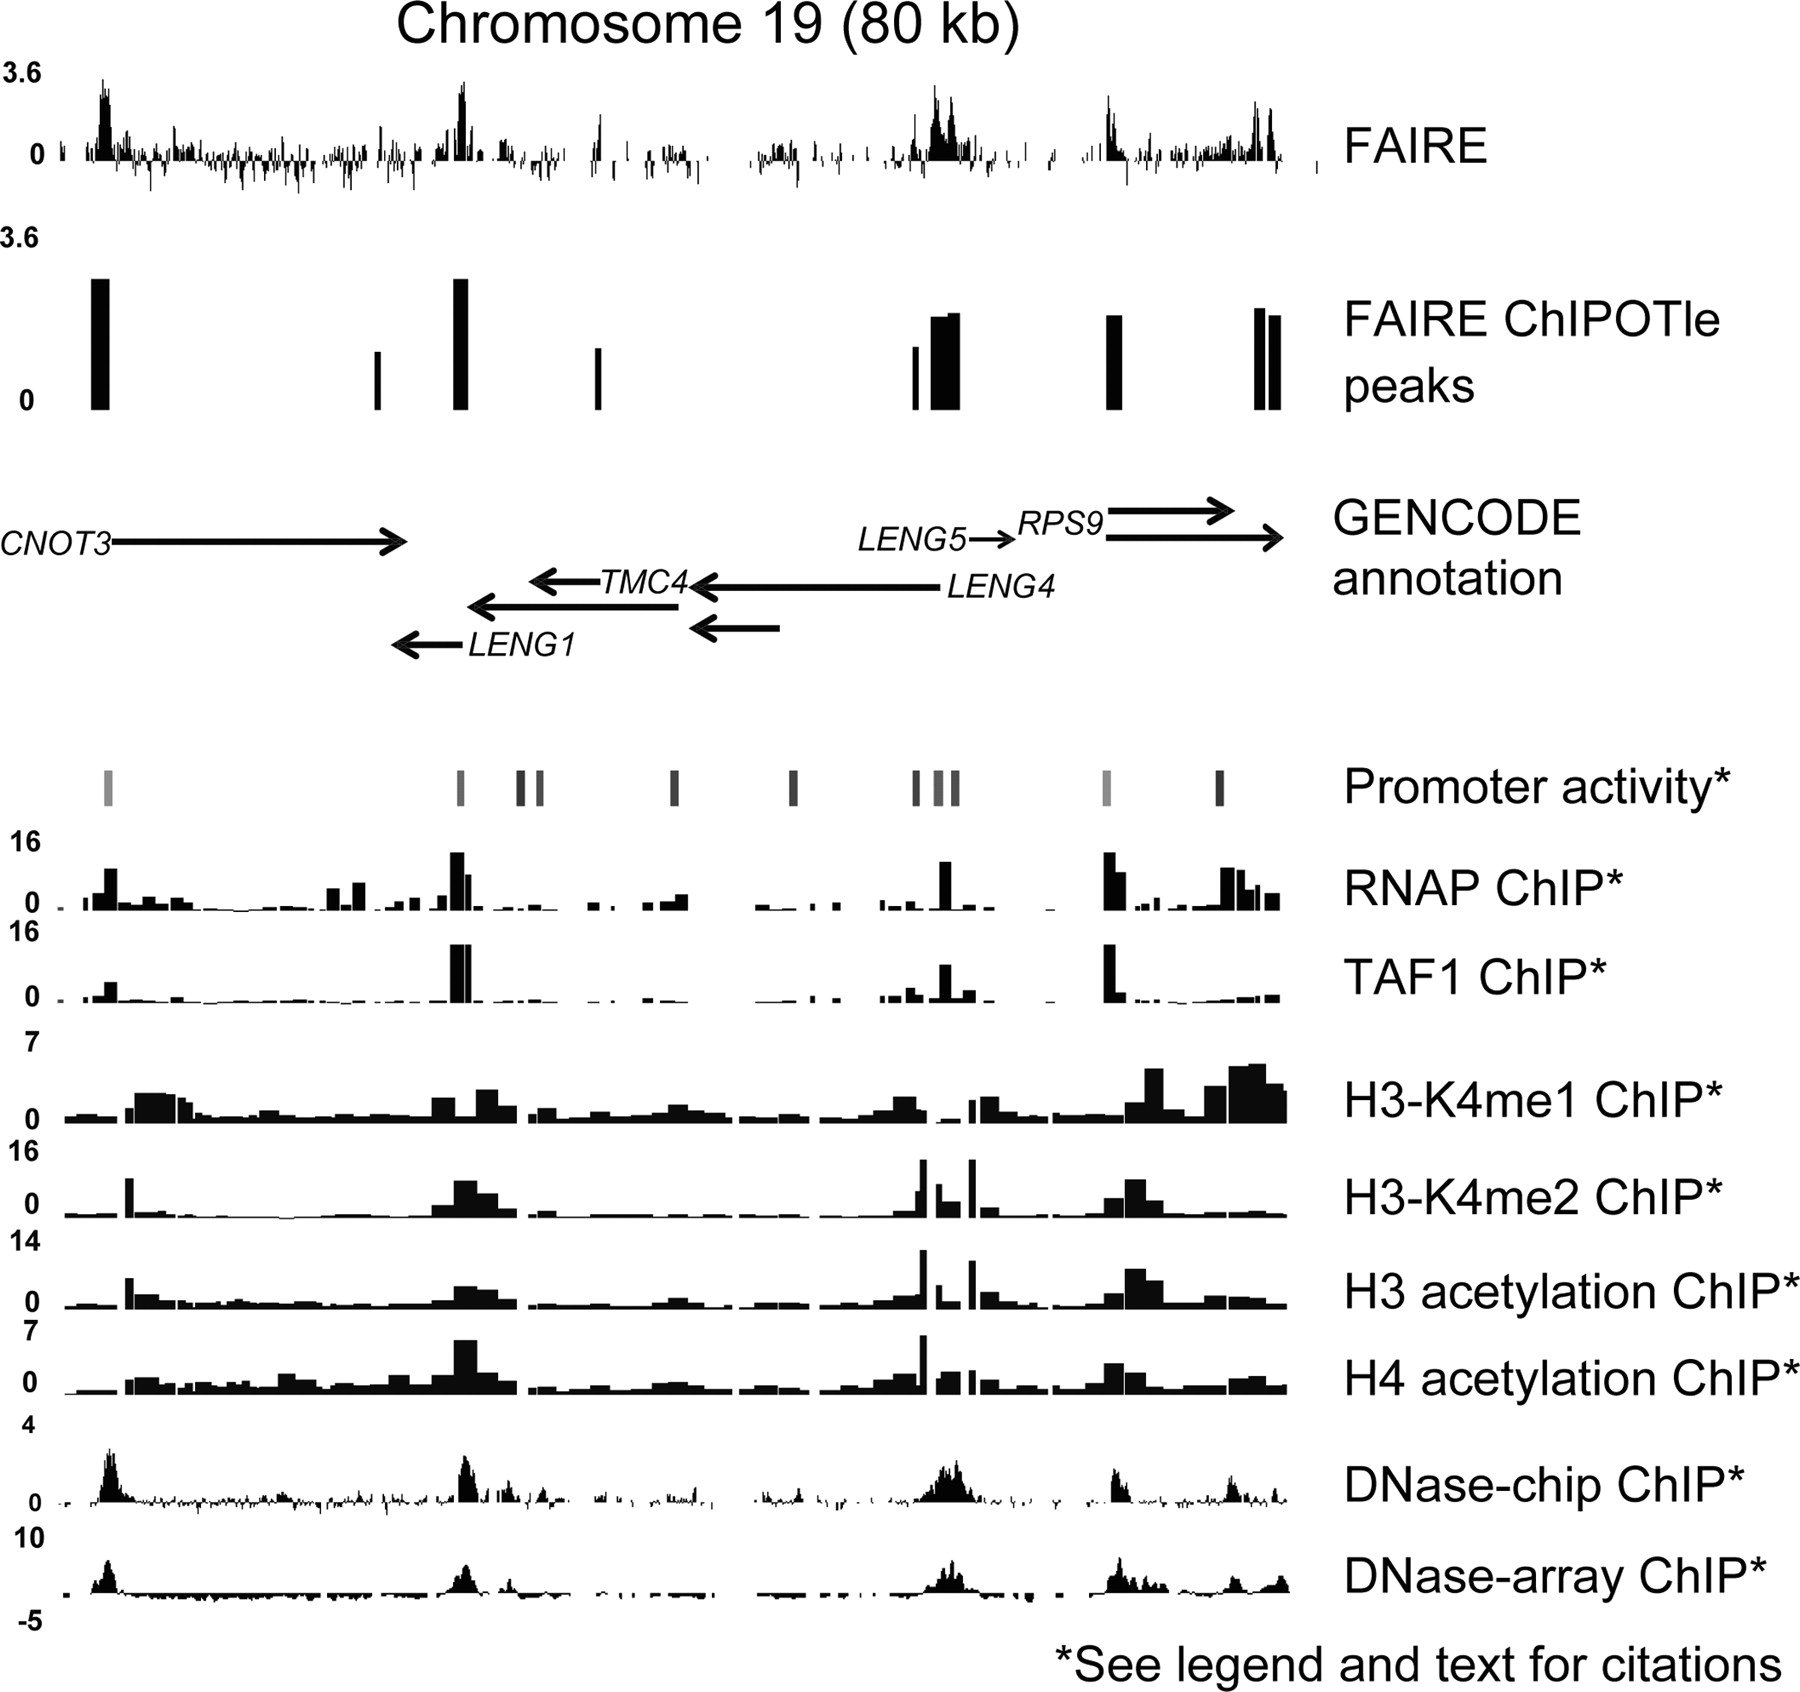
FAIRE enrichment of regulatory DNA across 80 kb of human chromosome 19. FAIRE data were loaded into the UCSC Genome Browser along with data sets generated by other ENCODE Consortium members (labeled on the right). The top track represents the average log2 ratios for the FAIRE data from four independent cultures (biological replicates), each of which were crosslinked separately (for 1, 2, 4, and 7 min). The second track shows FAIRE peaks (cutoff = P < 10−25) as determined by ChIPOTle (Buck et al. 2005). The GENCODE annotations represent experimentally verified transcribed segments (Ashurst et al. 2005; Harrow et al. 2006). “Promoter activity” represents the average activity of a reporter construct driven by each of the indicated regions and measured across 16 cell lines, where light gray bars indicate high activity and black bars no activity (Trinklein et al. 2003; Cooper et al. 2006). ChIP–chip data for RNAP and TAF1 from lung fibroblast cells (IMR90) are displayed as the –log10 of the P-value for each probe, scaled to 0–16 (Kim et al. 2005a, b). ChIP–chip data for histone H3 and H4 acetylation and H3K4 mono-, di-, and trimethylation in embryonic lung fibroblast cells (HFL-1) are shown as the ratio of ChIP signal over background (Koch et al. 2007). Finally, data on DNaseI hypersensitivity are shown for two different techniques, DNase-chip and DNase-array. Both techniques isolate DNA fragments flanking DNaseI cleavage sites and map them back to the genome using microarrays (Crawford et al. 2006; Sabo et al. 2006). The data shown for DNase-chip are the average log2 ratio for nine replicates (3 biological at 3 different enzyme concentrations), whereas the DNase-array data are the log2 ratios scaled so that a log2 ratio of 0 represents the 99% confidence bound on the experimental noise. The region shown corresponds to chromosome 19 coordinates 59,330,000 to 59,409,000.


