
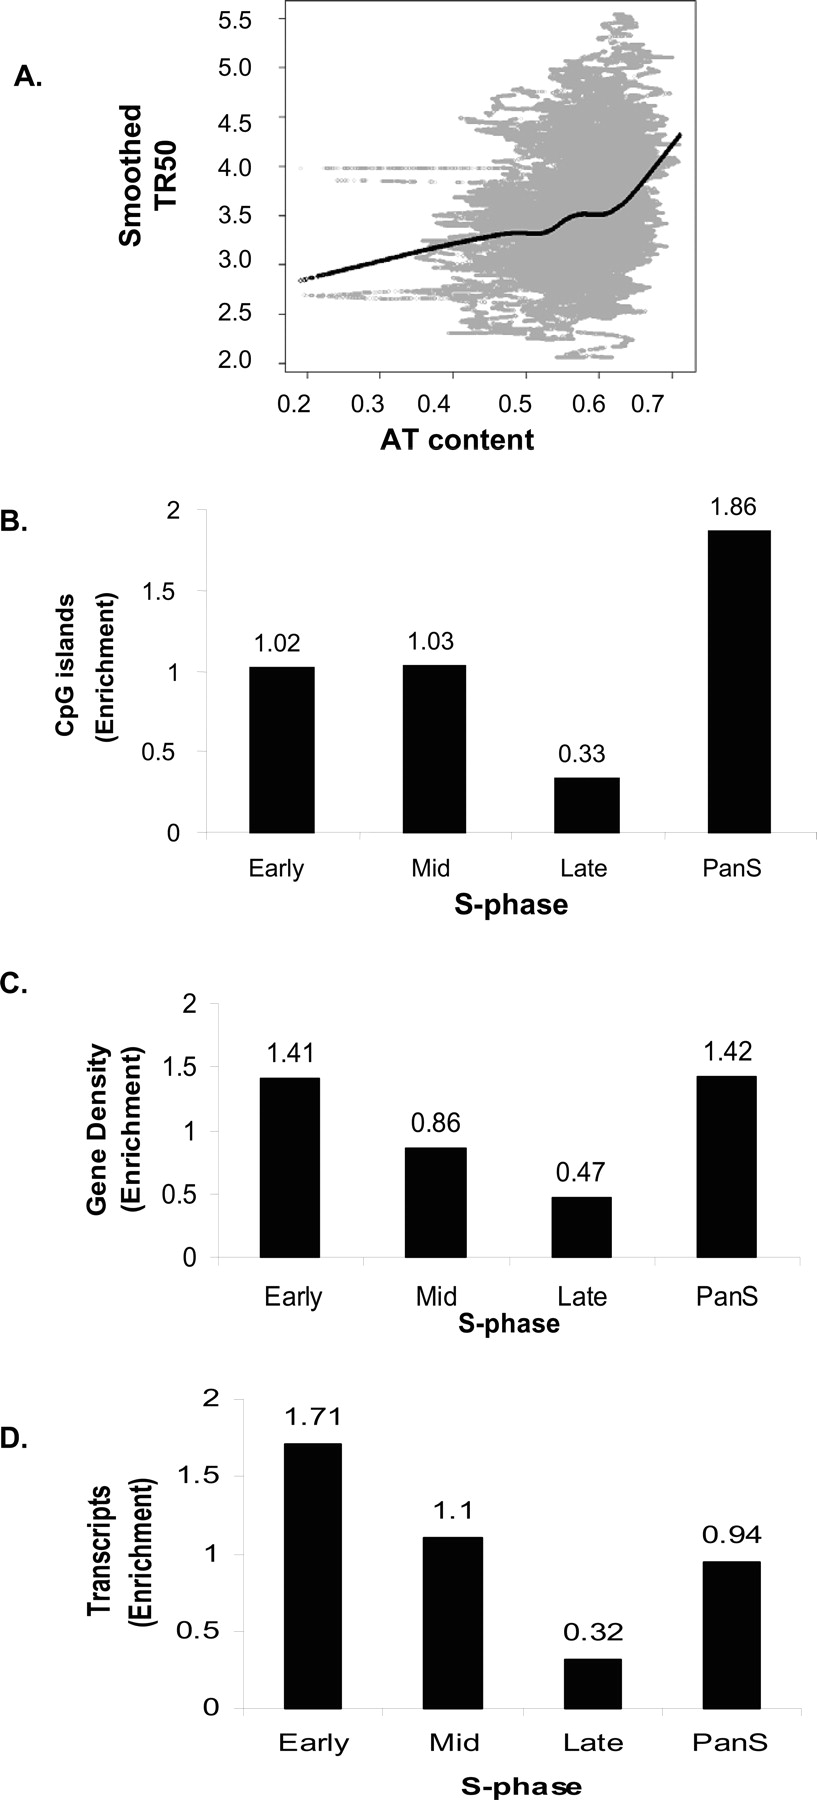
Figure 5.
Correlation between replication time and genomic features. (A) Plot of smoothed TR50 against AT content in a 10-kb sliding window. Lowess smoothed curve done at f = 0.3 (fraction of the data included in the running local fit) is overlaid in black to show the general trend. (B–D) Histograms showing distribution of (B) CpG islands, (C) gene density, and (D) transcripts (HeLa cells) against temporal segregation of replication.


