
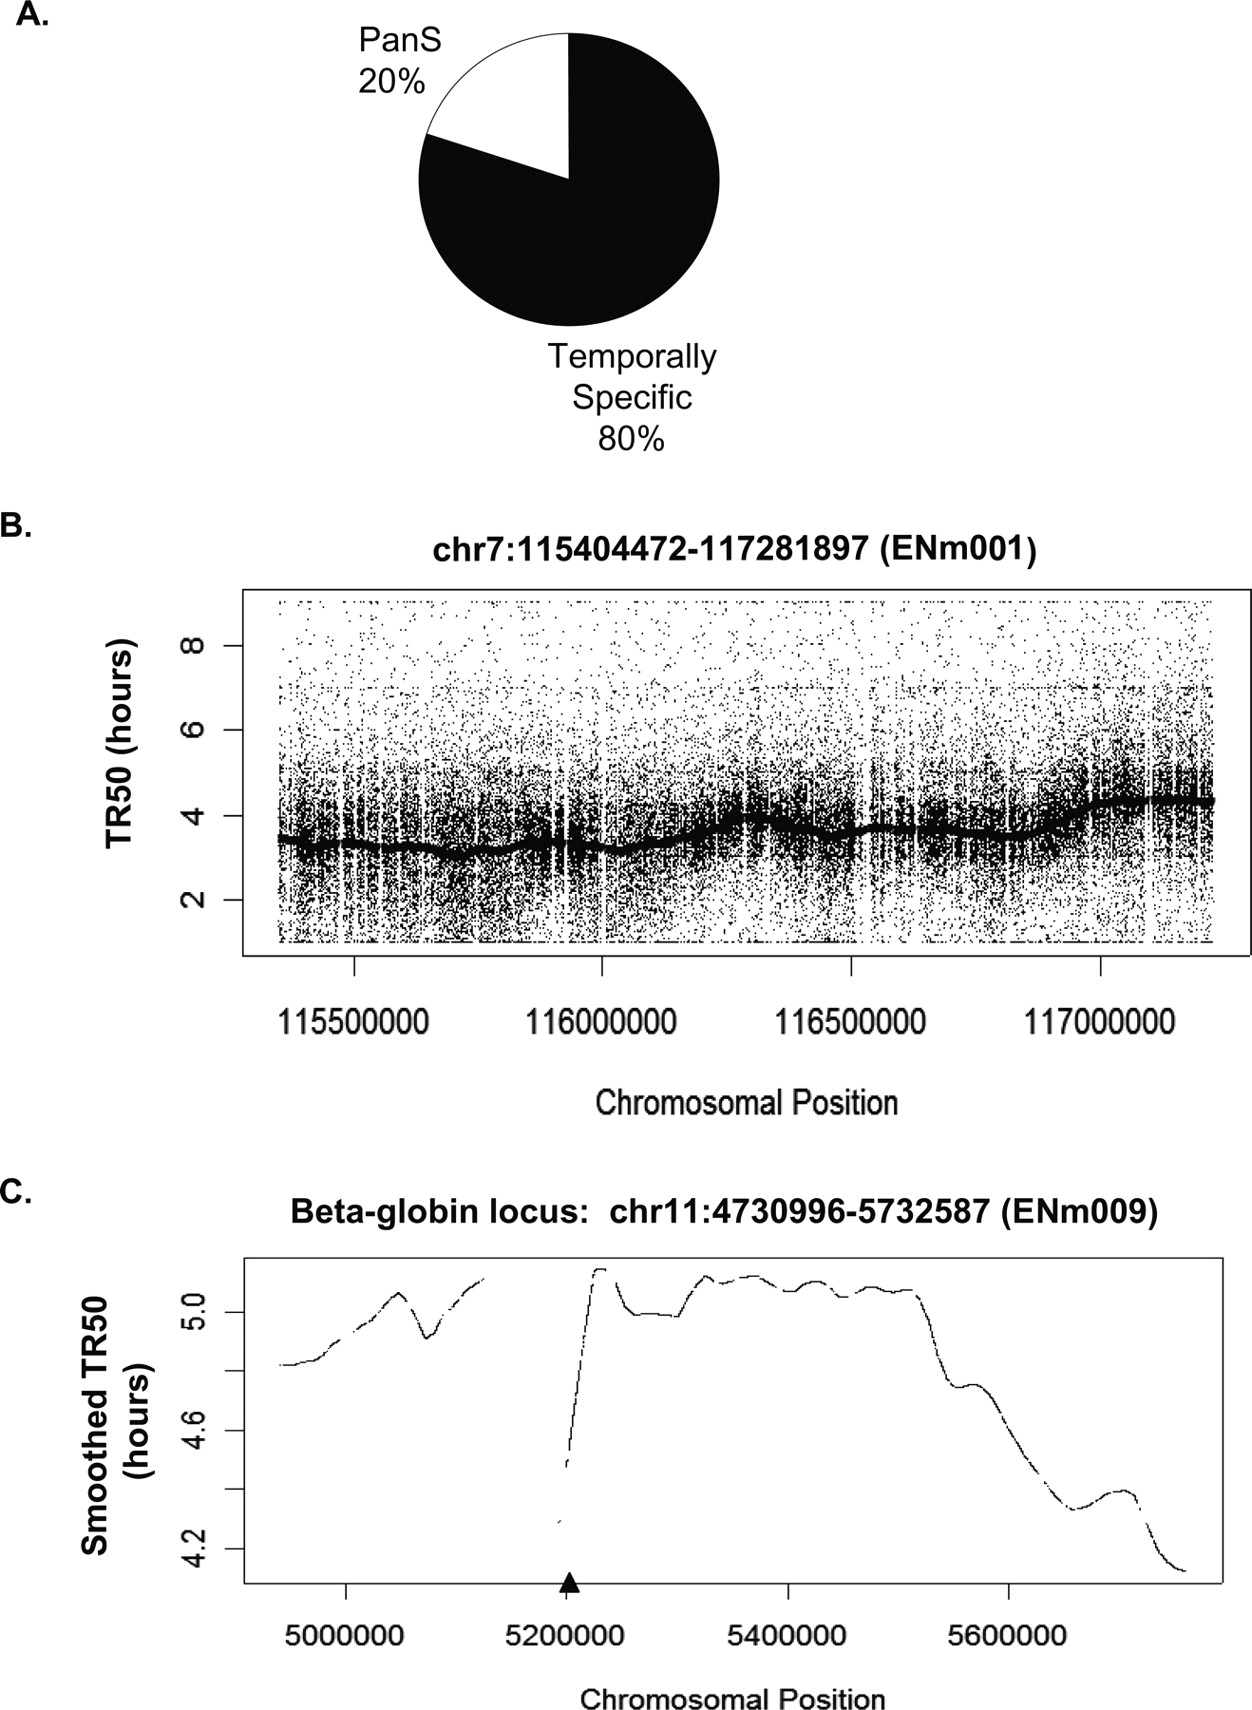
Temporal profile of replication of chromosomal segments. (A) Temporally specific versus pan-S distribution of replication for 1% of the human genome investigated in this study. (B) Raw TR50 data with a smoothed TR50 curve overlaid from the 1.9-Mb region on Chromosome 7. According to the ENCODE Consortium nomenclature, this chromosomal segment is referred to as ENm001 (http://hgwdev.cse.ucsc.edu/ENCODE/encode.hg17.html). (C) Smoothed TR50 data from the 1-Mb beta-globin locus (ENm009) on Chromosome 11. The lowest point in each valley indicates a site that is replicated before its adjoining segments and thus is likely to contain origins of replication. The gaps in the TR50 plots indicate the presence of repeats. In order to minimize cross-hybridization of oligonucleotides, repeat regions of the genome are not spotted on the tiling arrays. The triangle on the X-axis indicates the position of the known beta-globin origin.


