
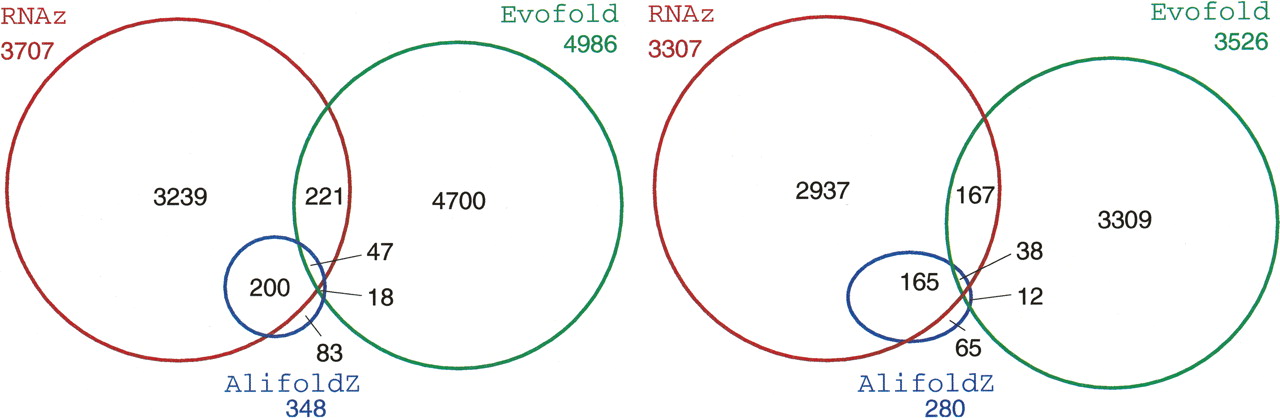
Figure 2.
Overlap of predictions from different methods (high significance level). The sets are drawn to scale for overlap in terms of nucleotides, and numbers indicate overlapping predictions. In addition, we give the total number of items outside the respective sets. (Left) All predictions; (right) predictions without coding exons and UTRs according to GENCODE annotation.


