
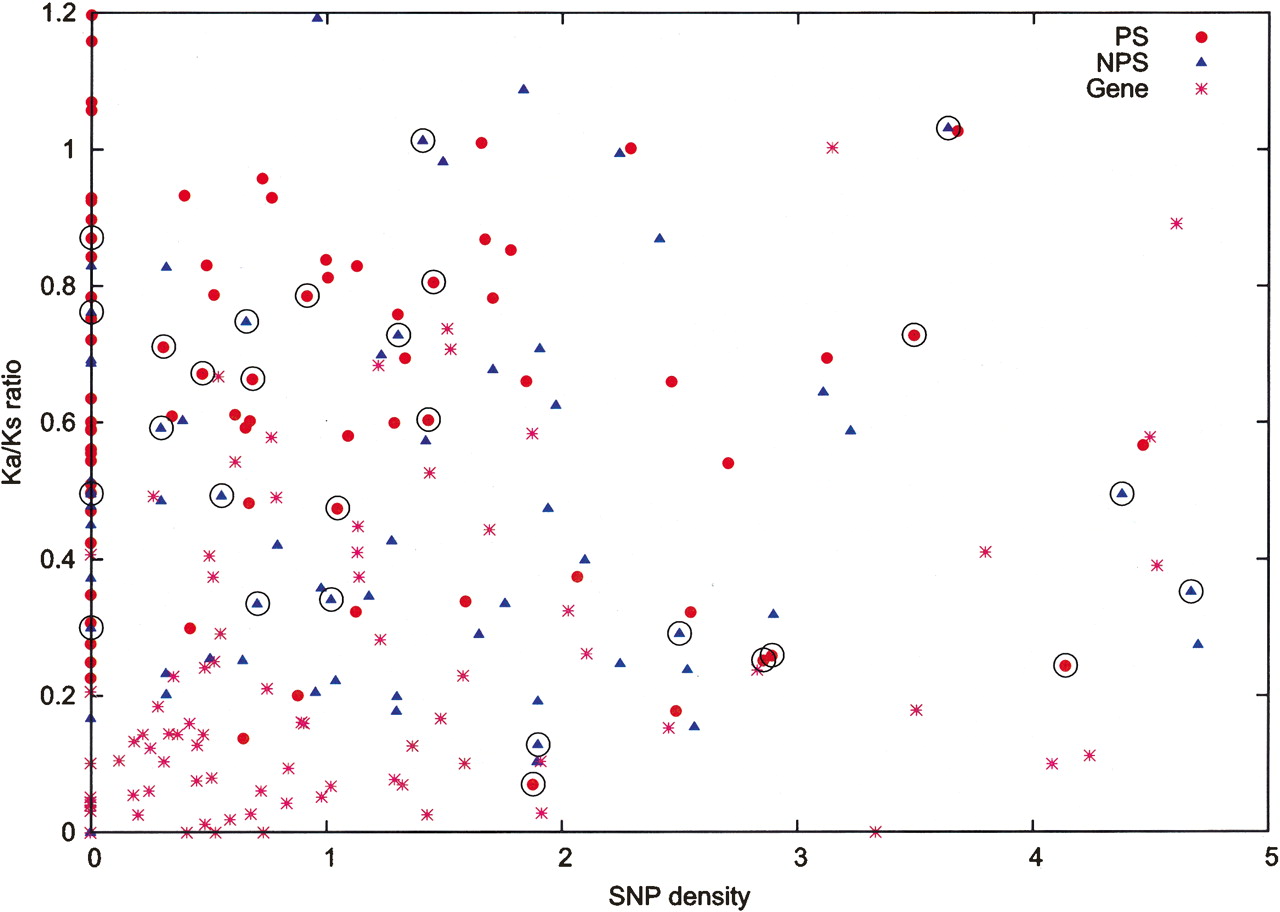
Figure 7.
Comparison of Ka/Ks ratio and SNP density for genes and pseudogenes. Only the CDS of a gene or pseudogene was used for analyses of Ka/Ks ratio and SNP density (number of SNP per 300 nucleotides). The Ka/Ks ratio was derived from the sequences between baboon and human. Data for transcribed pseudogenes are circled, and they are not statistically significant from the rest.


