
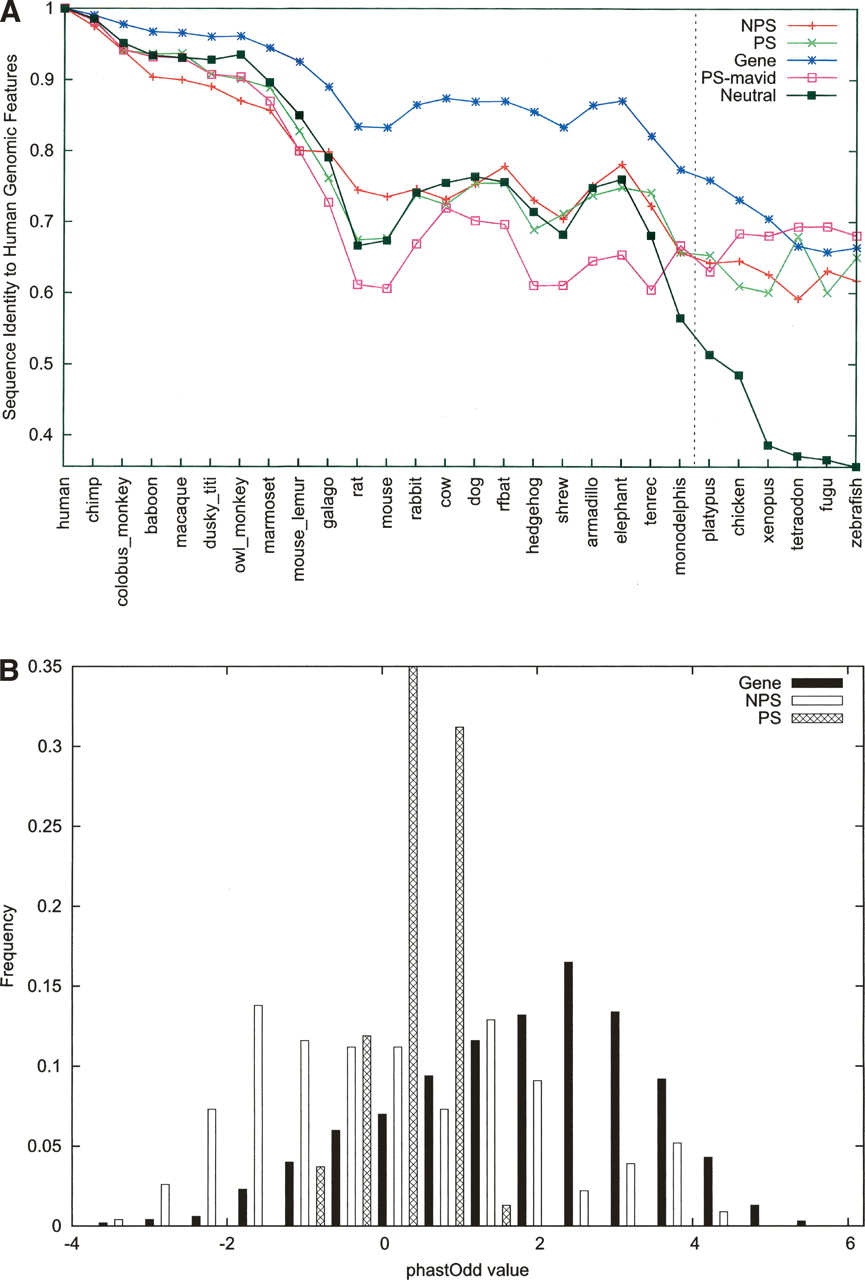
ENCODE pseudogenes overall exhibit a characteristic pattern of neutral evolution. (A) The orthologous sequences of each human genomic component (e.g., pseudogene) were retrieved from MSA data, and pairwise nucleotide sequence identity was calculated. Shown here are the means for each type of components (data labeled as in Fig. 4). A line representing neutral evolution is also shown using data derived from fourfold degenerate sites. (B) A score based on the log-likelihood of observing a genomic fragment under a model of constrained versus neutral evolution was computed for individual exons of genes or pseudogenes using the phastOdds program (Siepel et al. 2005). These scores were then normalized by exon length and plotted here as a histogram. A value near zero or negative indicates that the evolution of a sequence can be described better by a neutral model.


