
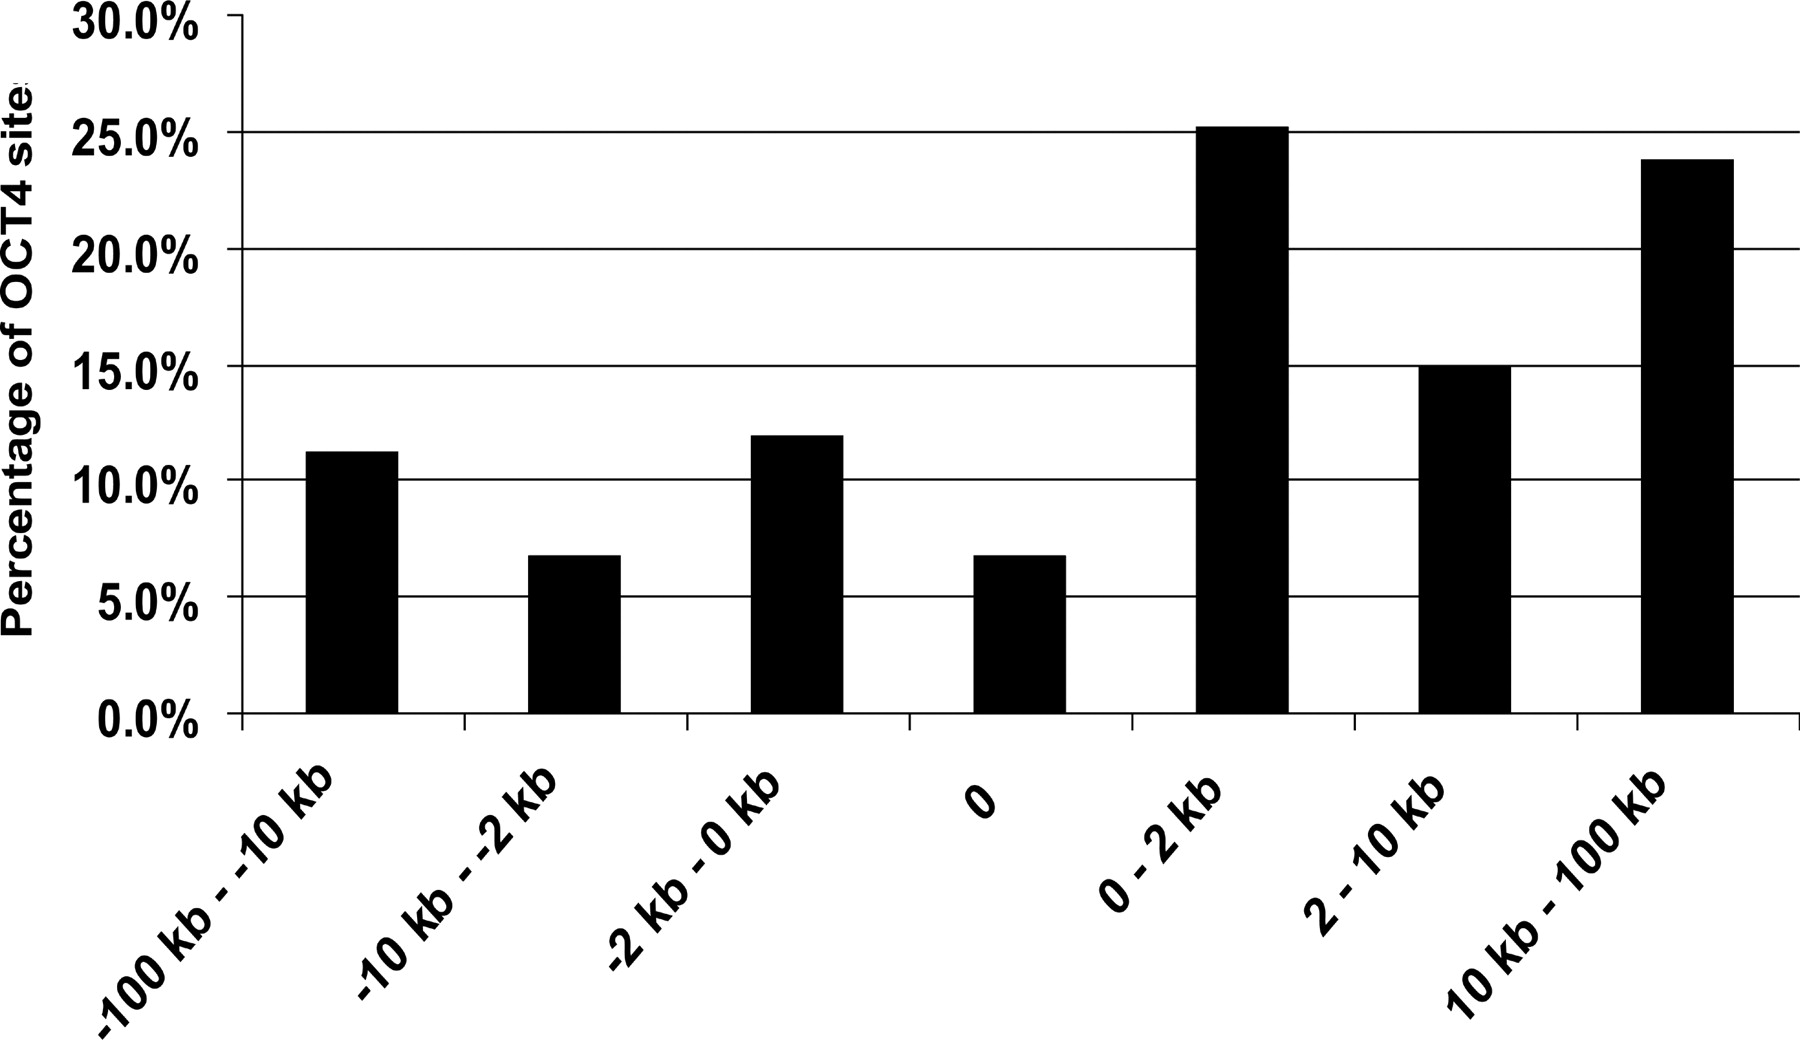
Distribution of OCT4-binding sites on the basis of distance relative to a start site. Shown is the percentage of OCT4-binding sites in the different regions. The categories include from 10 to 100 kb upstream of a start site, from 2 to 10 kb upstream of a start site, from 10 bp to 2 kb upstream of a start site, overlapping a start site, between 10 bp and 2 kb downstream from a start site, between 2 and 10 kb downstream from a start site, between 10 and 100 kb downstream from a start site, and those sites that are not within 100 kb upstream or downstream of a start site. The OCT4-binding regions were defined as peaks detected on duplicate ENCODE arrays using a peak calling program developed for ChIP-chip experiments (Bieda et al. 2006); the gene list was based on GENCODE Genes (Harrow et al. 2006).


