
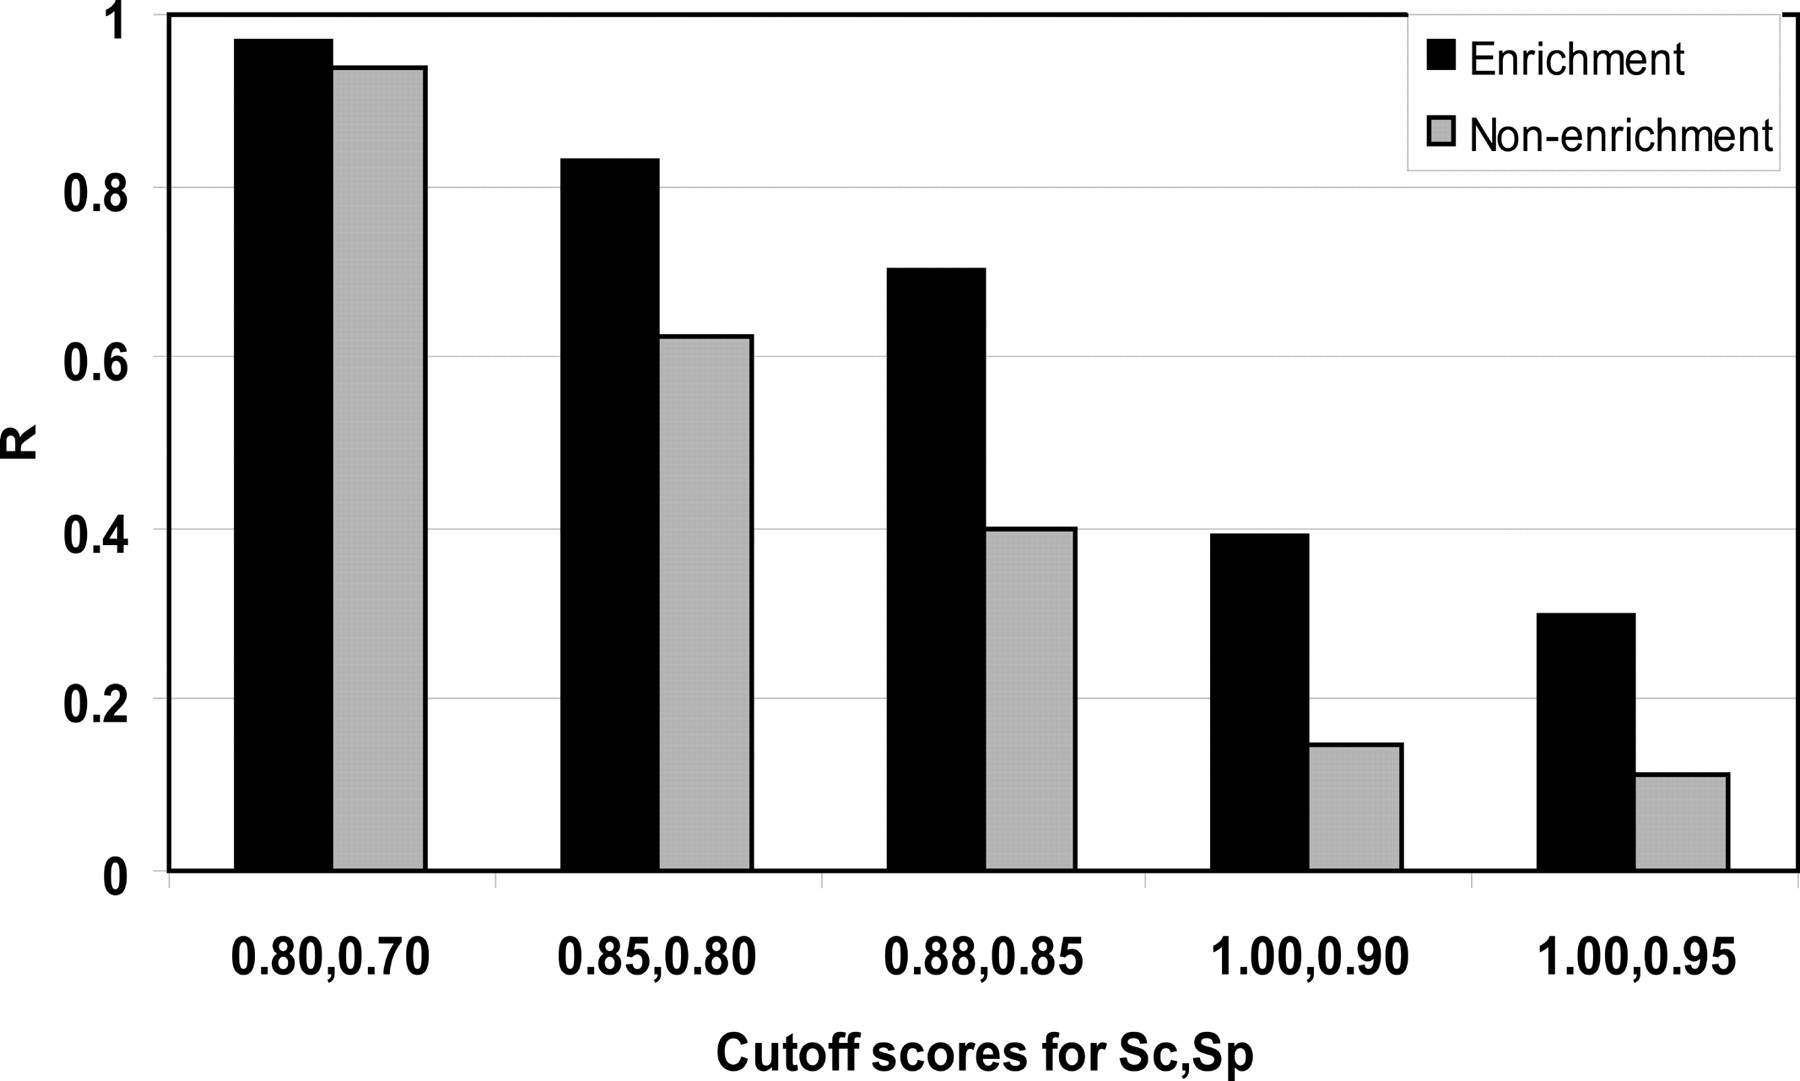
Figure 3.
A histogram plot showing the prediction rate (R) of OCT4 target promoters versus non-OCT4 target promoters at several combinations of the match to the core sequences (Sc_h) and to the PWMs (Sp_h). The values of 0.88 for Sc_h, 0.85 for Sc_p were chosen as cutoff thresholds for further analyses; these scores had a P-value of 0.00026.


