
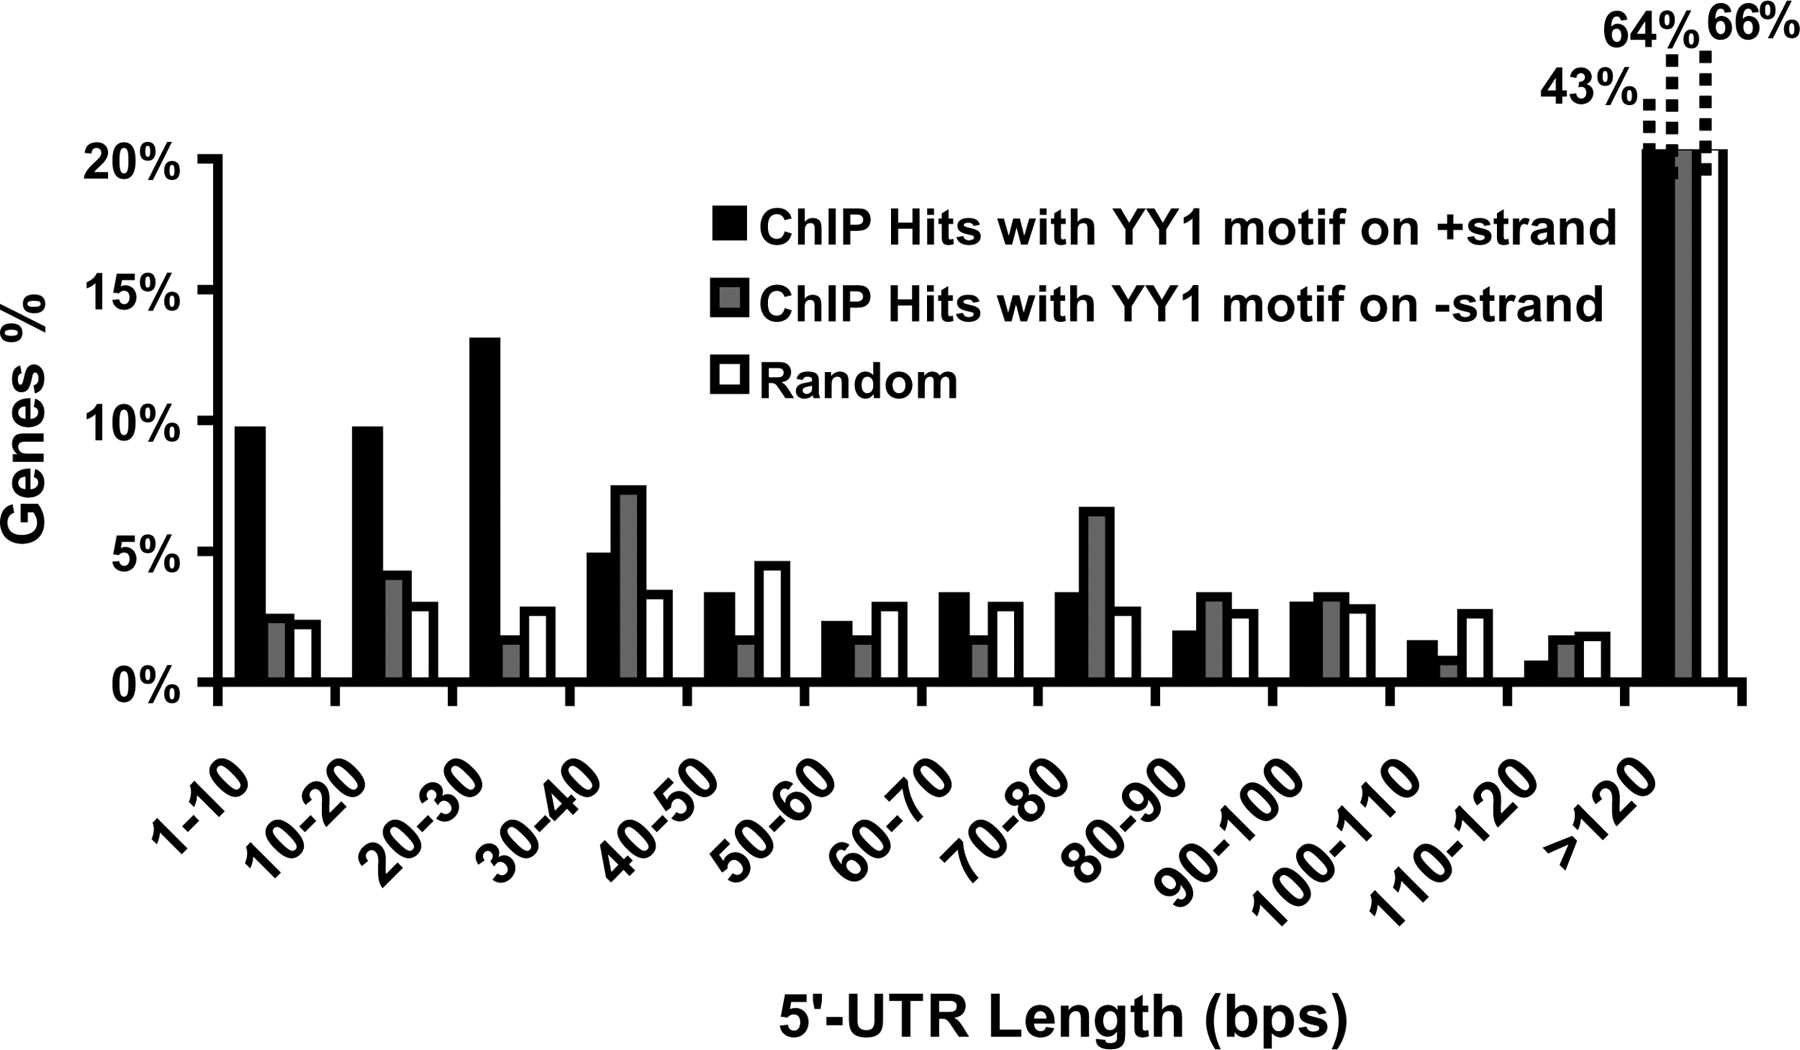
Figure 6.
5′-UTR lengths of genes that correspond to ChIP hits. 5′-UTR length distributions of ChIP hits with a YY1 motif hit on the plus strand (black bars) and on the minus strand (gray bars) were compared with the distribution of randomly selected genes (white bars) probed in the YY1 ChIP-chip experiment.


